Categories: Technical analysis

AXA Wave Analysis – 19 November, 2021

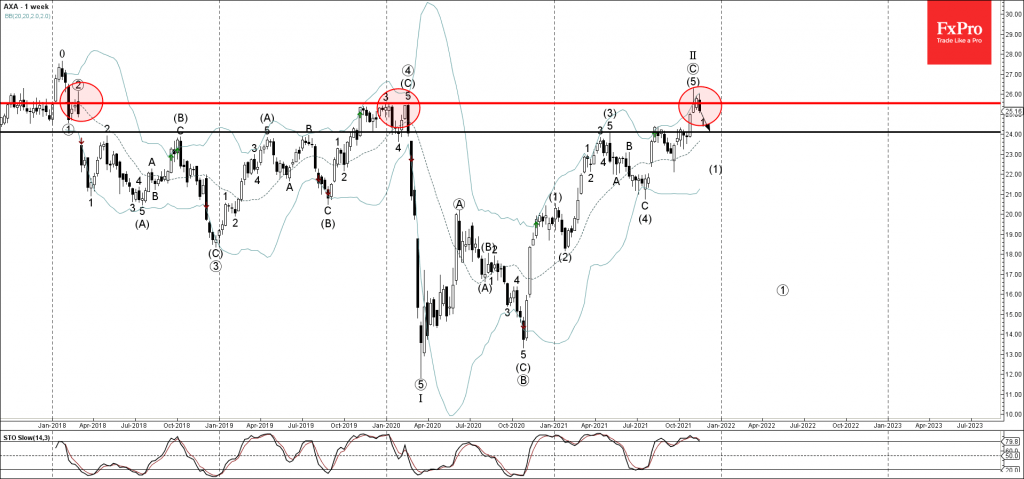
• AXA reversed from resistance area

• Likely to fall to support level 24.00                                                                          


AXA recently reversed down from the resistance area located between the long-term resistance level 25.50 (which has been reversing the price from the start of 2018) and the upper weekly Bollinger Band.

The downward reversal from this resistance area started the active downward impulse waves 1 and  (1).

Given the strength of the aforementioned resistance area and the overbought weekly Stochastic, oversold weekly Stochastic, AXA can be expected to fall further toward the next support level 24.00.

The FxPro Tech Analysis Team

The FxPro technical experts prepare a daily analysis of the most active currency pairs (majors, crosses, exotics) and commodities. Selected instruments are reviewed on daily trends (D1, H4), using the active Elliott Wave setups, Japanese candlesticks, indicators, and support/resistance levels.

Share
Published by
The FxPro Tech Analysis Team
Tags: AXA

Recent Posts

USDJPY Wave Analysis – 6 March 2025

- USDJPY under bearish pressure - Likely to fall to support level 146.00 USDJPY currency…

13 hours ago

EURCAD Wave Analysis – 6 March 2025

- EURCAD broke multi-year resistance 1.5100 - Likely to rise to resistance level 1.5770 EURCAD…

13 hours ago

Crypto recovers, but the rally lacks excitement

The crypto market experienced a recovery but remains cautious. A test of the support level…

15 hours ago

USDCAD Wave Analysis – 5 March 2025

- USDCAD reversed from the resistance zone - Likely to fall to support level 1.4300…

1 day ago

EURUSD Wave Analysis – 5 March 2025

- EURUSD broke the resistance zone - Likely to rise to resistance level 1.0900 EURUSD…

1 day ago

GBPUSD Wave Analysis – 5 March 2025

- GBPUSD broke the resistance zone - Likely to rise to resistance level 1.3000 GBPUSD…

1 day ago

This website uses cookies