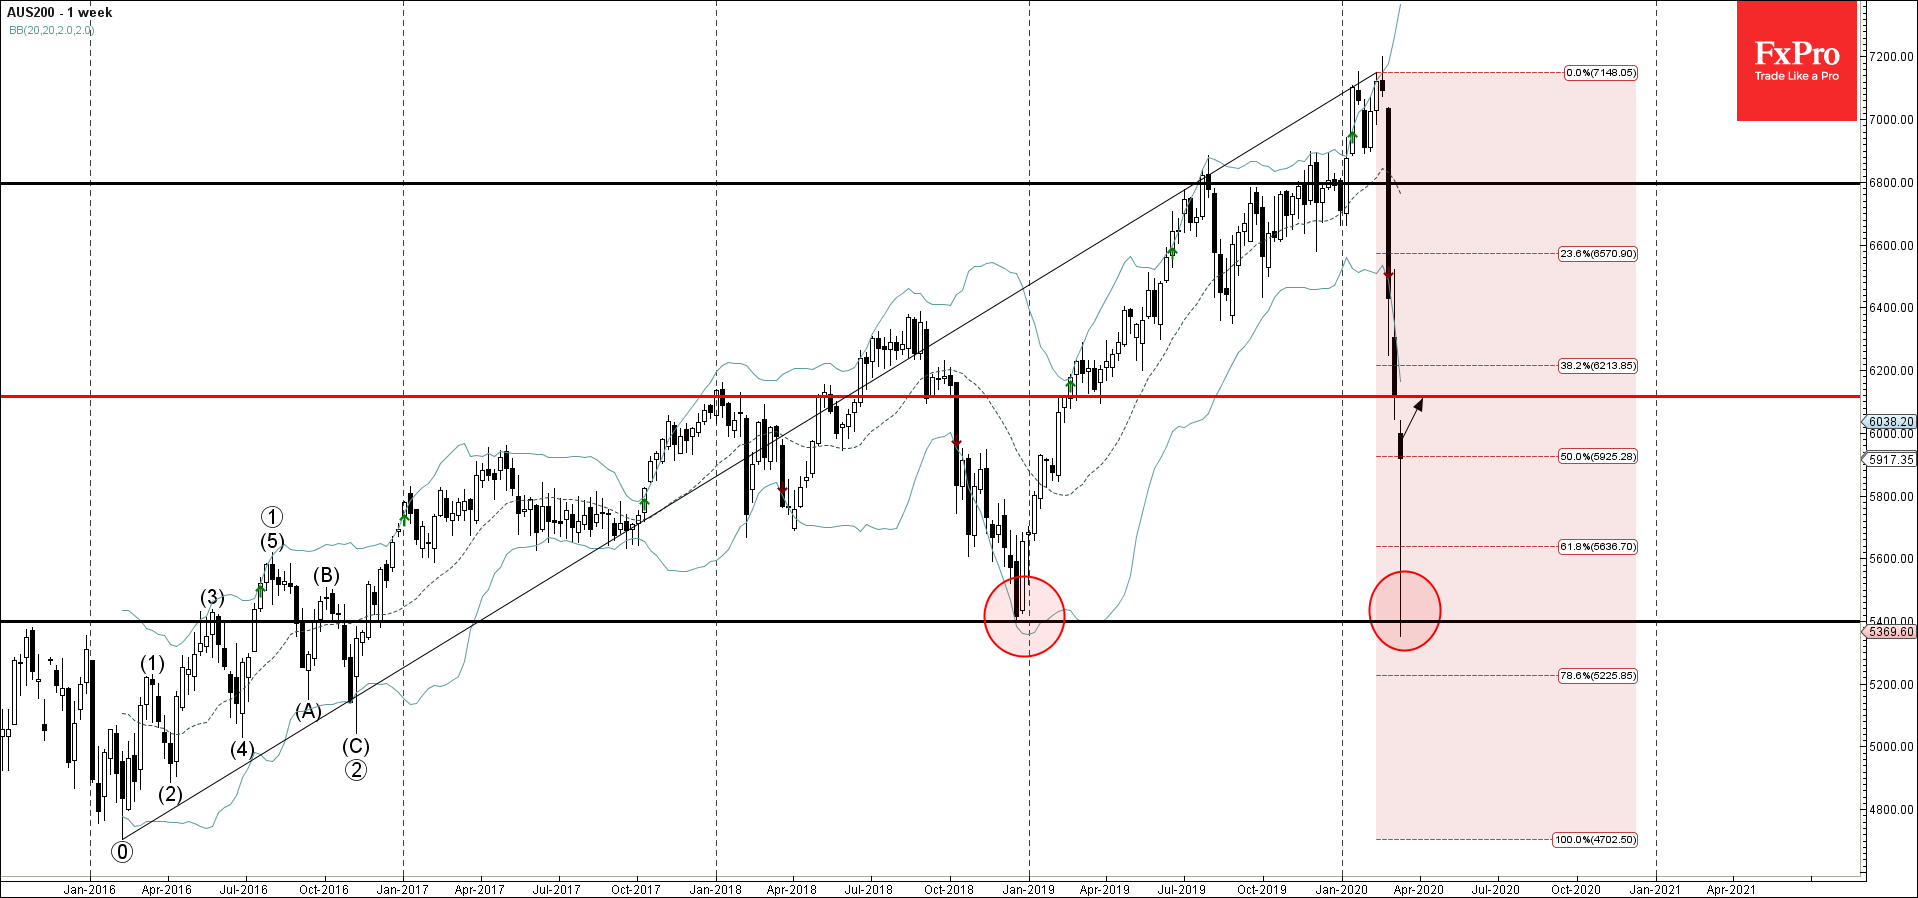
- AUS200 reversed from key support level 5400.00
- Likely to rise to 6115.00
AUS200 today reversed up sharply from the key support level 5400.00 (which stopped the previous multi-week correction at the end of 2018) standing close to the lower weekly Bollinger Band and the 61.8% Fibonacci retracement of multi-year uptrend from eth start of 2016.
The upward reversal from this support area is likely to form the weekly candlesticks reversal pattern Hammer – if the index stay near the current levels.
AUS200 is likely to rise further toward the next resistance level 6115.00 (former support from the start of 2019).