Categories: Technical analysis

AUDUSD Wave Analysis (30.11)

  • AUDUSD reversed from resistance area
  • Further losses are likely

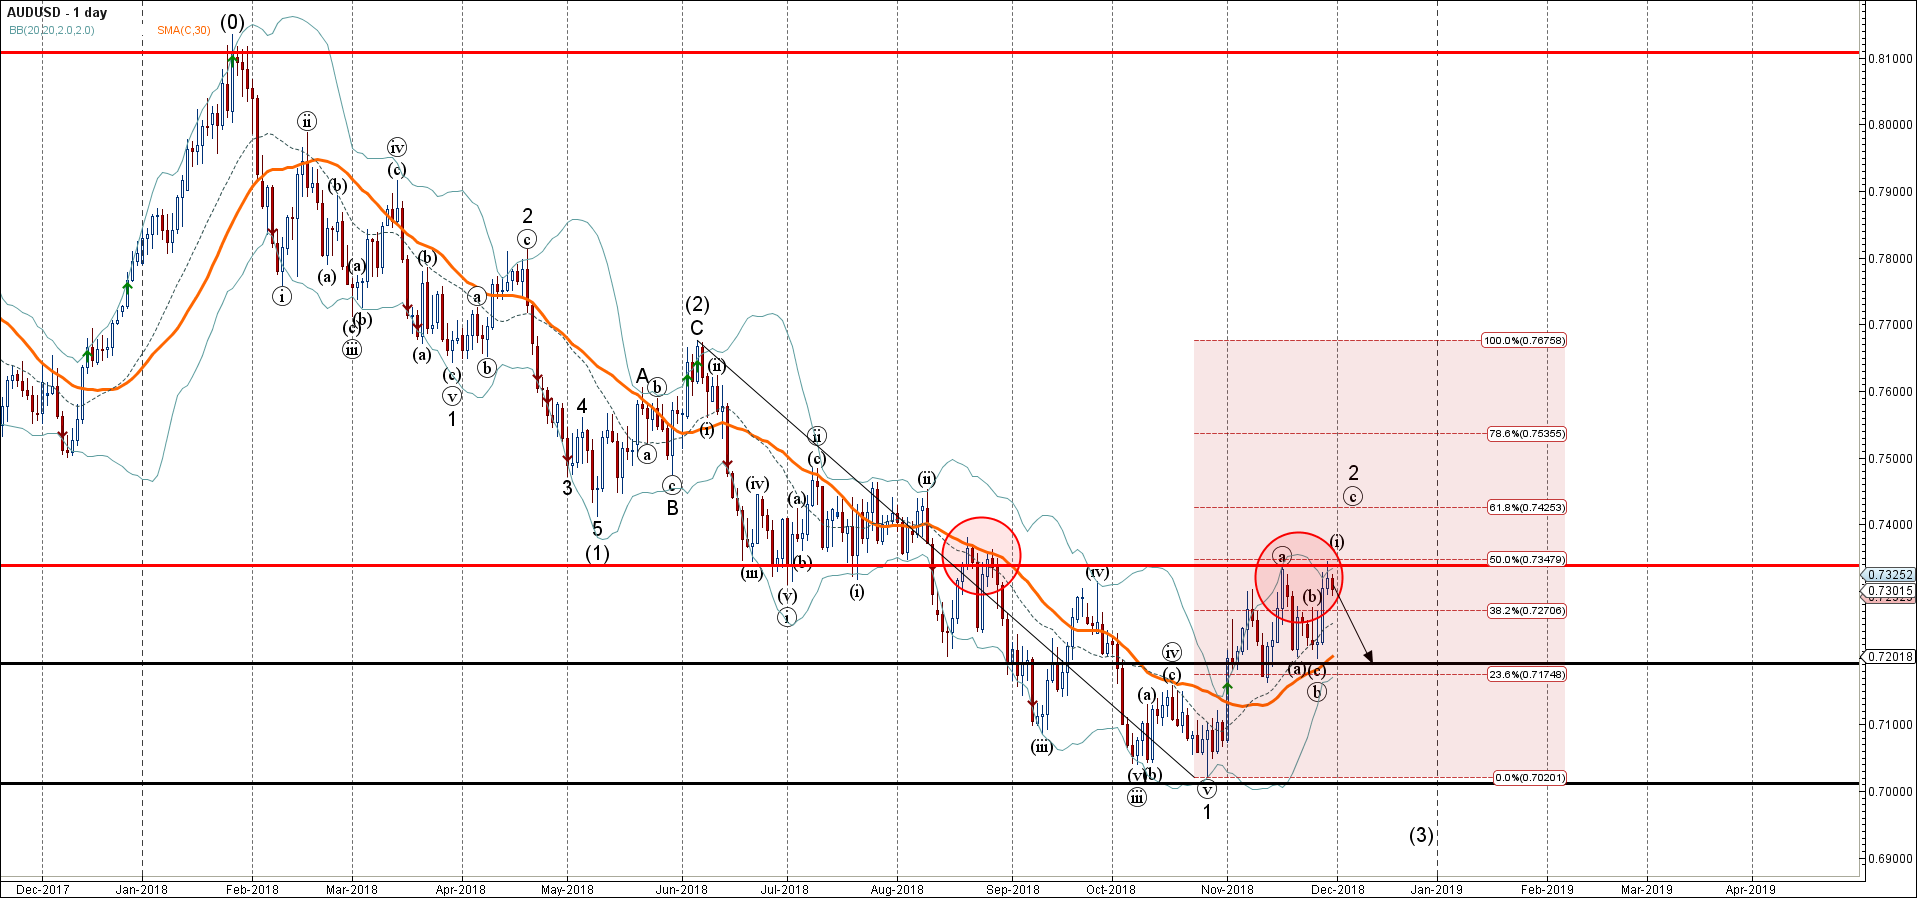
AUDUSD recently reversed down from the resistance area lying between the pivotal resistance level 0.7340 (which has reversed the price multiple times from the middle of August) and the upper daily Bollinger Band.

The resistance zone near the resistance level 0.7340 was further strengthened by the 50% Fibonacci correction level of the previous extended downward impulse 1 from June.

AUDUSD is expected to fall further and re-test the next support level 0.7190 (which reversed the previous minor corrections (a) and (c)).

The FxPro Tech Analysis Team

The FxPro technical experts prepare a daily analysis of the most active currency pairs (majors, crosses, exotics) and commodities. Selected instruments are reviewed on daily trends (D1, H4), using the active Elliott Wave setups, Japanese candlesticks, indicators, and support/resistance levels.

Share
Published by
The FxPro Tech Analysis Team
Tags: AUDUSD

Recent Posts

Adobe Wave Analysis 3 May 2024

- Adobe reversed from support zone - Likely to rise to resistance level 500.00 Adobe…

2 hours ago

EURGBP Wave Analysis 3 May 2024

- EURJPY reversed from support zone - Likely to rise to resistance level 0.8625 EURGBP…

2 hours ago

How Low Can the USDJPY Go?

USDJPY was slipping below 153 on Friday morning, a three-week low and having lost over…

9 hours ago

Bitcoin’s Downtrend, Solana and Ethereum Form Double Bottom

Market picture  Crypto market capitalisation rose 3.3% in 24 hours to $2.22 trillion. Local capitalisation…

15 hours ago

EURJPY Wave Analysis 2 May 2024

- EURJPY under strong bearish pressure - Likely to fall to support level 163.10 EURJPY…

1 day ago

WTI crude oil Wave Analysis 2 May 2024

- WTI broke round support level 80.00 - Likely to fall to support level 76.00…

1 day ago

This website uses cookies