Categories: Technical analysis

AUDUSD Wave Analysis – 29 April, 2020

  • AUDUSD broke resistance area
  • Likely to rise up to 0.66800

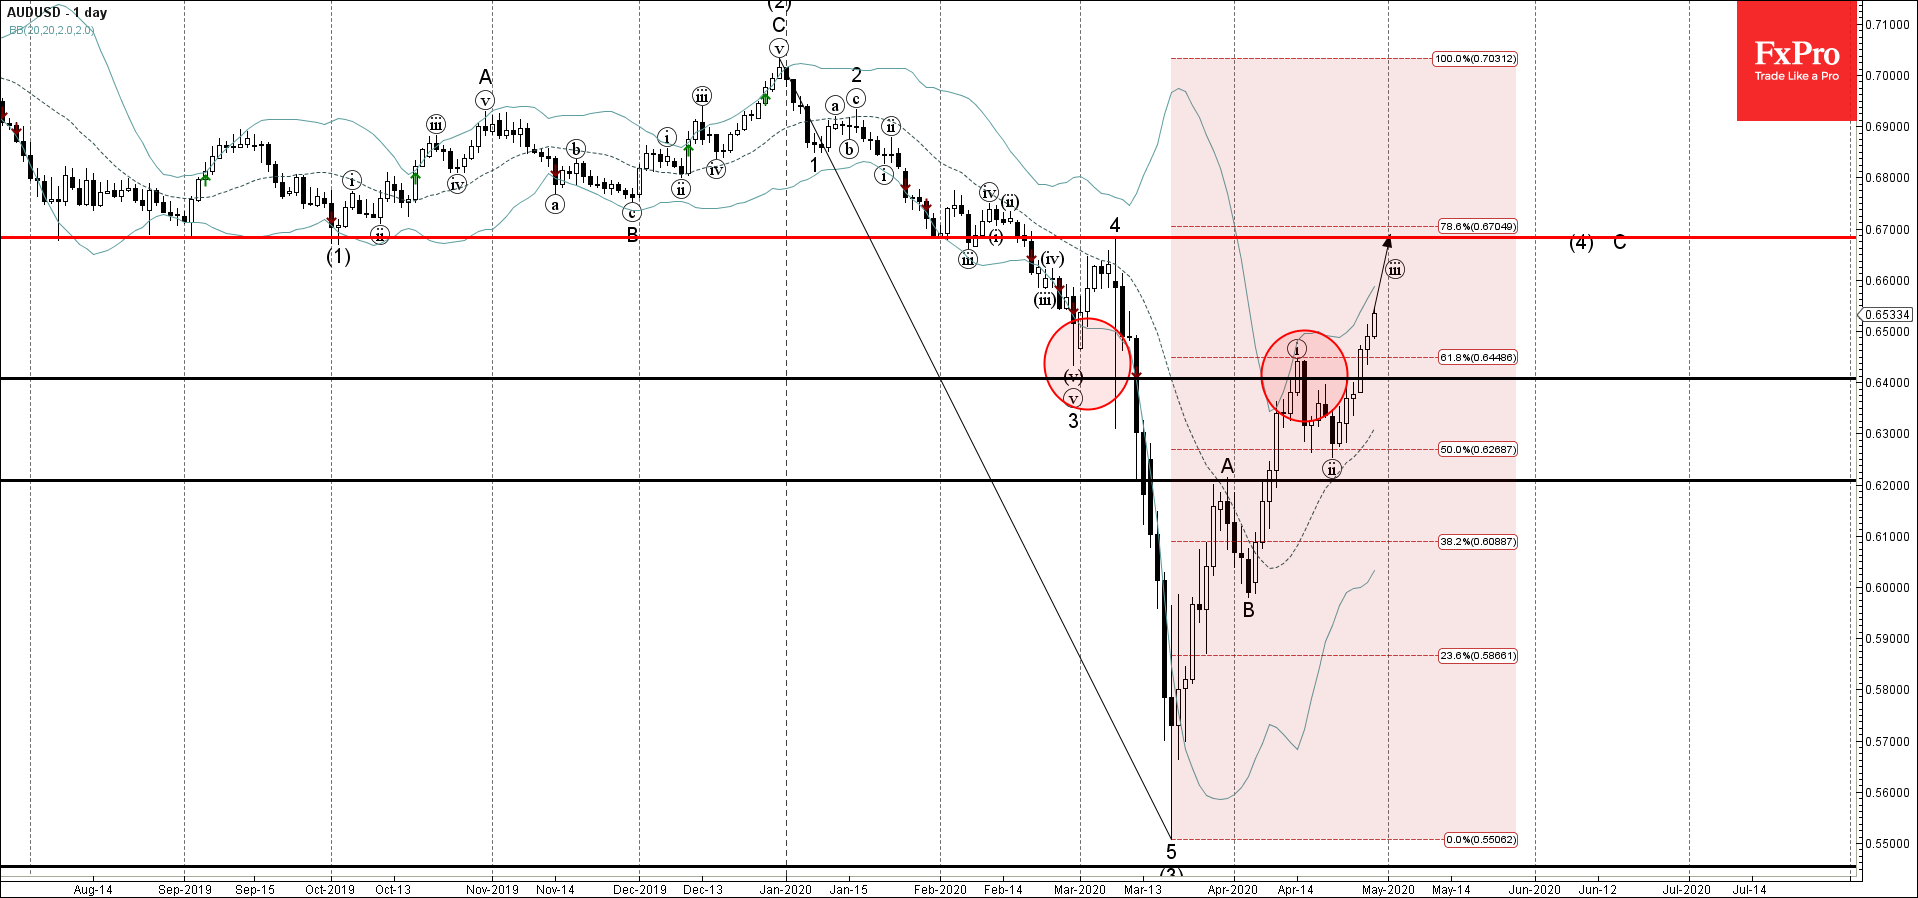
AUDUSD recently broke the resistance area lying between the resistance level 0.6400 (former support from March, which stopped the previous impulse wave (i)) and the 61.8% Fibonacci correction of the earlier downward impulse wave (3) from December.

The breakout of this resistance area accelerated the active impulse wave C – which belongs to wave (4) from March.

AUDUSD is expected to rise further toward the next pivotal resistance level 0.6680 (top of the previous correction 4 and the target for the completion of wave C)


The FxPro Tech Analysis Team

The FxPro technical experts prepare a daily analysis of the most active currency pairs (majors, crosses, exotics) and commodities. Selected instruments are reviewed on daily trends (D1, H4), using the active Elliott Wave setups, Japanese candlesticks, indicators, and support/resistance levels.

Share
Published by
The FxPro Tech Analysis Team
Tags: AUDUSD

Recent Posts

AUDJPY Wave Analysis – 5 December 2025

AUDJPY: ⬆️ Buy - AUDJPY broke long-term resistance level 102.30 - Likely to rise to…

4 hours ago

Aptos Wave Analysis – 5 December 2025

Aptos: ⬇️ Sell - Aptos testing major support at 1.688 - Likely to fall to…

4 hours ago

Pro News Weekly: Market Shake-Up, Dollar Drops, Gold Surges, Bitcoin Wobbles!

Welcome to Pro News Flash! 💵 The U.S. dollar slips 🏆 Major stock indices struggle…

10 hours ago

Solana Wave Analysis – 5 December 2025

Solana: ⬇️ Sell - Solana reversed from resistance zone - Likely to fall to support…

11 hours ago

EURAUD Wave Analysis – 5 December 2025

EURAUD : ⬇️ Sell - EURAUD broke the support level 1.7600 - Likely to fall…

11 hours ago

Forex has set its priorities

In 2026, experts favour the yen, see modest euro growth, and expect pressure on the…

15 hours ago

This website uses cookies