Categories: Technical analysis

AUDUSD Wave Analysis 28 September 2023

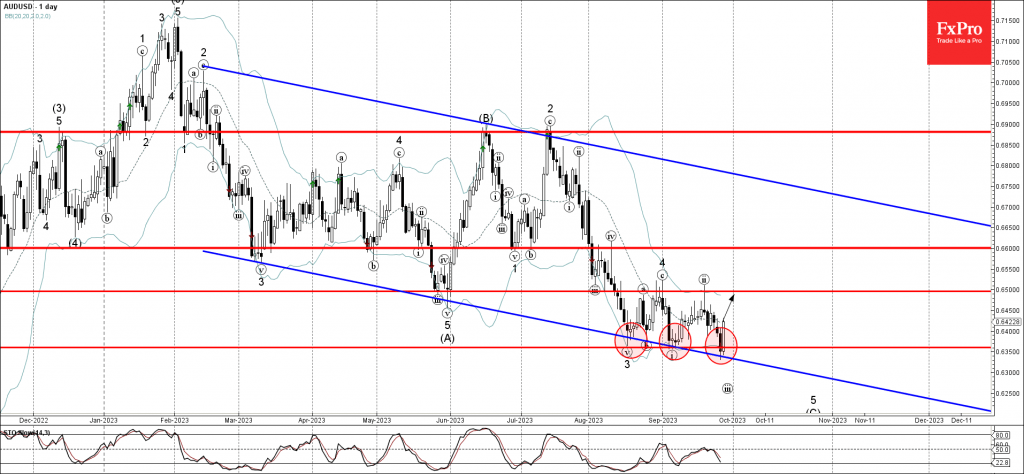
– AUDUSD reversed from support level 0.6350

– Likely to rise to resistance level 0.6500

AUDUSD currency pair recently reversed up from the key support level 0.6350 (which has been reversing the price from the middle of August) intersecting with the lower daily Bollinger Band and the support trendline of the wide down channel from February.

The upward reversal from the support level 0.6350 is likely to form the daily candlesticks reversal pattern Bullish Engulfing.

Given the bullish divergence on the daily Stochastic indicator, AUDUSD currency pair can be expected to rise further toward the next resistance level 0.6500 (which stopped the previous waves (a), 4 and (ii)).

The FxPro Tech Analysis Team

The FxPro technical experts prepare a daily analysis of the most active currency pairs (majors, crosses, exotics) and commodities. Selected instruments are reviewed on daily trends (D1, H4), using the active Elliott Wave setups, Japanese candlesticks, indicators, and support/resistance levels.

Share
Published by
The FxPro Tech Analysis Team
Tags: AUDUSD

Recent Posts

EURCAD Wave Analysis 6 September 2024

- EURCAD reversed from pivotal support level 1.4900 - Likely to rise to resistance level…

2 days ago

EURUSD Wave Analysis 6 September 2024

- EURUSD reversed from support level 1.1030 - Likely to rise to resistance level 1.1200…

2 days ago

Further Unwinding of Carry Trade

The unwinding of the carry trade in the FX market continues, with the major safe…

2 days ago

Bitcoin pressured by risk-off mood

Market Picture The pressure on risk assets continues, pushing the crypto market capitalisation back below…

2 days ago

AUDUSD Wave Analysis 5 September 2024

- AUDUSD reversed from support level 0.6700 - Likely to rise to resistance level 0.6800…

2 days ago

Gold Wave Analysis 5 September 2024

- Gold reversed from support level 2475.00 - Likely to rise to resistance level 2535.00…

2 days ago

This website uses cookies