Categories: Technical analysis

AUDUSD Wave Analysis – 24 February 2023

• AUDUSD broke key support level 0.6800

• Likely to fall to support level 0.6700

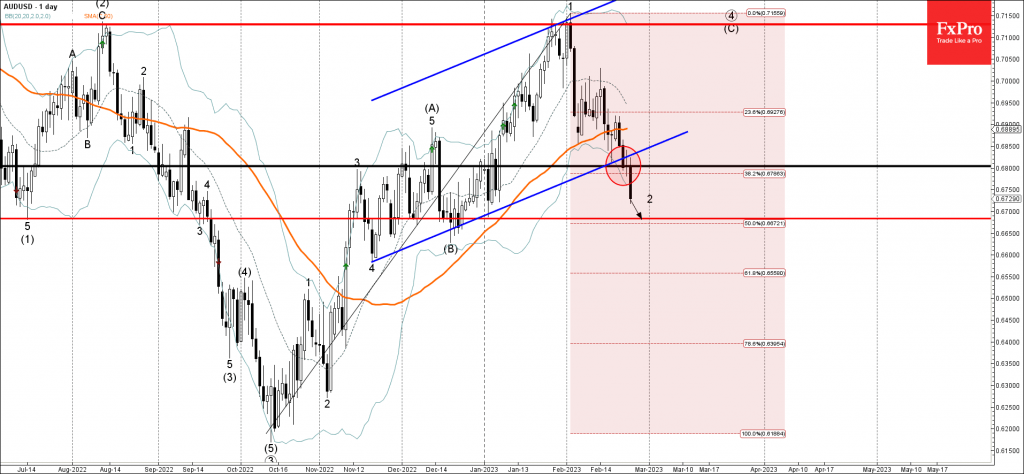
AUDUSD currency pair recently broke the key support level 0.6800 (which formed the daily Hammer earlier this month) intersecting with the daily up channel from November and the 38.2% Fibonacci correction of the previous upward impulse from October .

The breakout of the support level 0.6800 continues the active short-term correction 2.

Given the widespread USD dollar bullishness, AUDUSD can be expected to fall further toward the next support level 0.6700 (target price for the completion of the active wave 2).

The FxPro Tech Analysis Team

The FxPro technical experts prepare a daily analysis of the most active currency pairs (majors, crosses, exotics) and commodities. Selected instruments are reviewed on daily trends (D1, H4), using the active Elliott Wave setups, Japanese candlesticks, indicators, and support/resistance levels.

Share
Published by
The FxPro Tech Analysis Team
Tags: AUDUSD

Recent Posts

S&P 500 Wave Analysis 7 May 2024

- S&P 500 reversed from support level 5000.00 - Likely to rise to resistance level…

34 mins ago

USDCHF Wave Analysis 7 May 2024

- USDCHF reversed from support zone - Likely to rise to resistance level 0.9200 USDCHF…

35 mins ago

EURUSD at the equilibrium, where will it go next?

The single currency is trading near $1.076, waiting for further cues and facing serious resistance…

5 hours ago

Bitcoin can’t accelerate but won’t give up trying

Market picture  The crypto market capitalisation fell by 1.7% in 24 hours to $2.29 trillion,…

10 hours ago

USDJPY Wave Analysis 6 May 2024

- USDJPY reversed from support zone - Likely to rise to resistance level 155.65 USDJPY…

1 day ago

Gold Wave Analysis 6 May 2024

- Gold reversed from support zone - Likely to rise to resistance level 2400.00 Gold…

1 day ago

This website uses cookies