Categories: Technical analysis

AUDUSD Wave Analysis – 24 December, 2019

  • AUDUSD approached resistance level 0.6930
  • Likely to fall to 0.6840

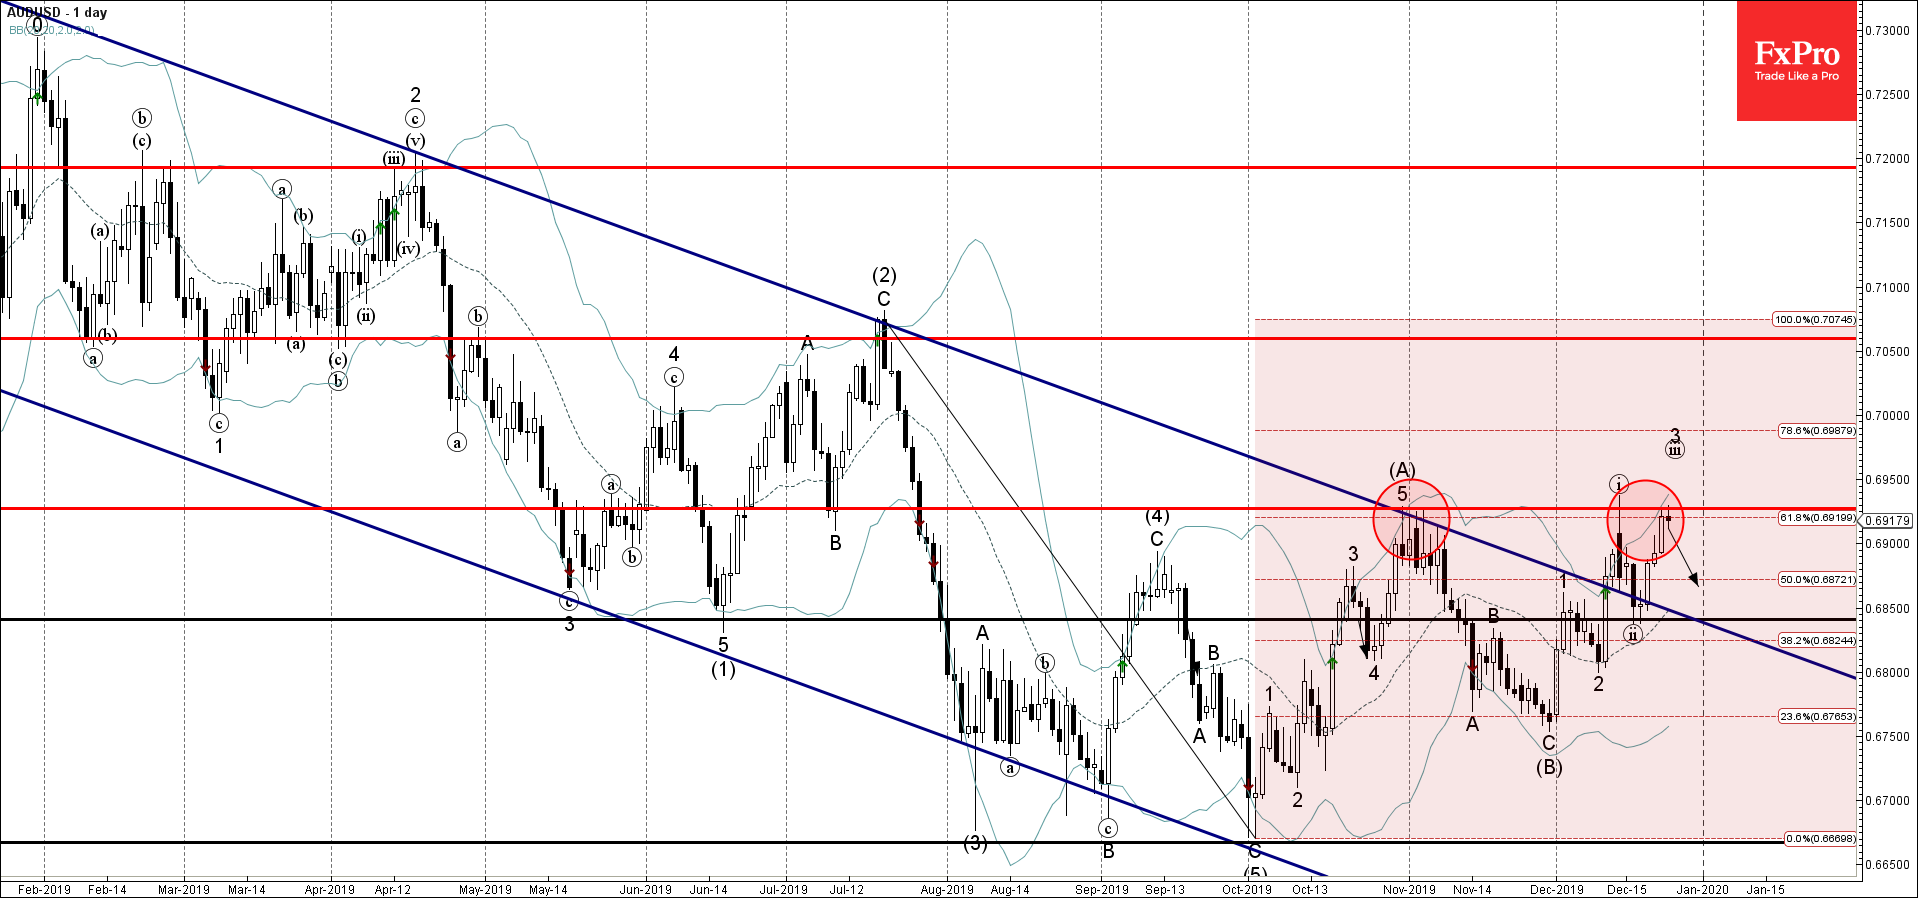
AUDUSD recently approached the resistance level 0.6930 (former monthly high from October and November) – strengthened by the upper daily Bollinger Band and by the 61.8% Fibonacci correction of the previous downward impulse from July.

The resistance level 0.6930 also previously reversed the sharp short-term impulse wave (i) in the middle of December.

AUDUSD is expected to fall further toward the next support level 0.6840 (low of the previous short-term correction (ii)).

The FxPro Tech Analysis Team

The FxPro technical experts prepare a daily analysis of the most active currency pairs (majors, crosses, exotics) and commodities. Selected instruments are reviewed on daily trends (D1, H4), using the active Elliott Wave setups, Japanese candlesticks, indicators, and support/resistance levels.

Share
Published by
The FxPro Tech Analysis Team
Tags: AUDUSD

Recent Posts

USDJPY Wave Analysis 26 April 2024

- USDJPY broke key resistance level 155.00 - Likely to rise to resistance level 160.00…

2 days ago

Ebay Wave Analysis 26 April 2024

- Ebay reversed from support level 49.35 - Likely to rise to resistance level 52.55…

2 days ago

False Alert with Yen Interventions?

Even though the Bank of Japan left the key rate and parameters of the QE…

3 days ago

Cooler Bitcoin

Market picture  Market Dynamics: The cryptocurrency market stabilised, losing just 0.1% of capitalisation and dropping to…

3 days ago

GBPCAD Wave Analysis 25 April 2024

- GBPCAD reversed from key support level 1.6910 - Likely to rise to resistance level…

3 days ago

GBPAUD Wave Analysis 25 April 2024

- GBPAUD reversed from support level 1.9135 - Likely to rise to resistance level 1.9360…

3 days ago

This website uses cookies