Categories: Technical analysis

AUDUSD Wave Analysis 11 August 2023


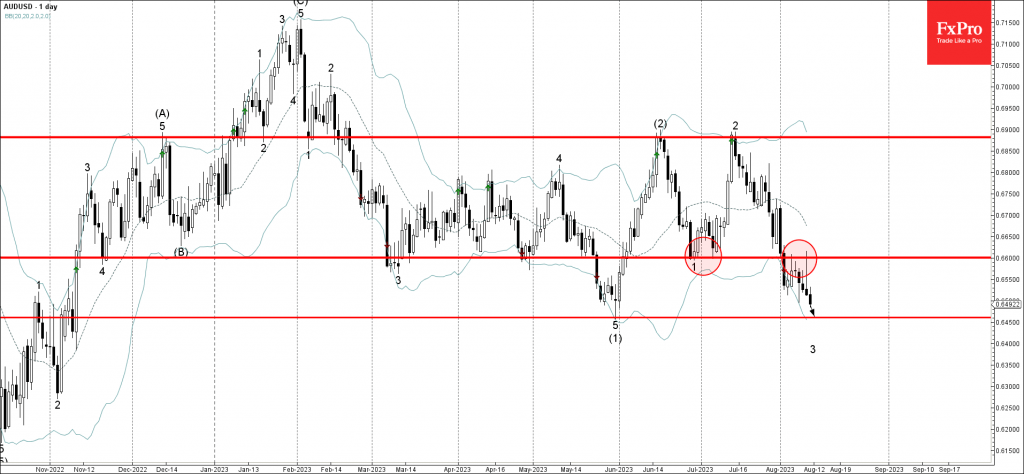
– AUDUSD reversed from resistance level 0.6600

– Likely to fall to support level 0.6460

AUDUSD currency pair recently reversed down twice from the pivotal resistance level 0.6600 (former strong support from June and July).

The downward reversal from the resistance level 0.6600 created the daily candlesticks reversal pattern Shooting Star.

Given the continued dollar gains, AUDUSD can be expected to fall further toward the next support level 0.6460 (former multi-month low from April).

The FxPro Tech Analysis Team

The FxPro technical experts prepare a daily analysis of the most active currency pairs (majors, crosses, exotics) and commodities. Selected instruments are reviewed on daily trends (D1, H4), using the active Elliott Wave setups, Japanese candlesticks, indicators, and support/resistance levels.

Share
Published by
The FxPro Tech Analysis Team
Tags: AUDUSD

Recent Posts

NZDUSD Wave Analysis 18 December 2024

- NZDUSD broke long-term support level 0.5770 - Likely to fall to support level 0.5500…

7 hours ago

Gold Wave Analysis 18 December 2024

- Gold under bearish pressure - Likely to fall to support level 2555.00 Gold under…

7 hours ago

Apple Wave Analysis 17 December 2024

- Apple rising inside impulse wave 3 - Likely to reach resistance level 260.00 Apple…

1 day ago

EURGBP Wave Analysis 17 December 2024

- EURGBP reversed from resistance level 0.8300 - Likely to fall to support level 0.8225…

1 day ago

USDCAD Wave Analysis 16 December 2024

- USDCAD reversed from support zone - Likely to rise to resistance level 1.4300. USDCAD…

2 days ago

AUDUSD Wave Analysis 16 December 2024

- AUDUSD reversed from support zone - Likely to rise to resistance level 0.6400 AUDUSD…

2 days ago

This website uses cookies