Categories: Technical analysis

AUDUSD Wave Analysis 1 July 2024

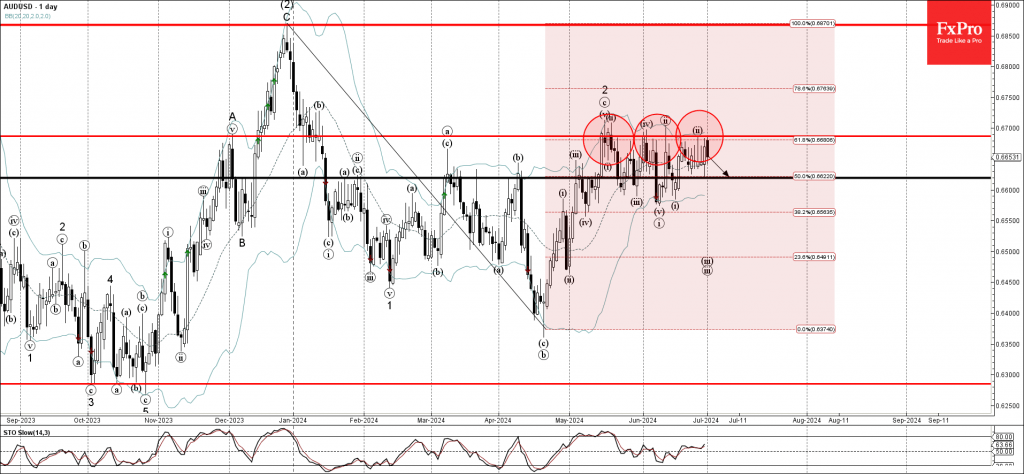
– AUDUSD reversed from strong resistance zone

– Likely to fall to support level 0.6620

AUDUSD currency pair recently reversed down from the strong resistance zone located between the key resistance level 0.6685 (which has been steadily reversing the price from the start of May) and the upper daily Bollinger Band.

This resistance zone was further strengthened by the 61.8% Fibonacci correction of the previous downward impulse from December.

AUDUSD currency pair can be expected to fall further toward the next support level 0.6620 (former minor support from the end of June).

The FxPro Tech Analysis Team

The FxPro technical experts prepare a daily analysis of the most active currency pairs (majors, crosses, exotics) and commodities. Selected instruments are reviewed on daily trends (D1, H4), using the active Elliott Wave setups, Japanese candlesticks, indicators, and support/resistance levels.

Share
Published by
The FxPro Tech Analysis Team
Tags: AUDUSD

Recent Posts

WTI Wave Analysis 4 July 2024

- WTI broke resistance level 81.10 - Likely to rise to resistance level 86.00 WTI…

2 hours ago

Natural gas Wave Analysis 4 July 2024

Natural gas under the bearish pressure Likely to fall to support level 2.200 Natural gas…

2 hours ago

Crude Oil moved up but looks vulnerable

Crude oil inventories in US commercial storage fell by 12.2 million barrels last week, marking…

10 hours ago

Bitcoin is more likely to fall to $51.5K than rise to $65.8K

Market picture The crypto market plunged 3.6% in 24 hours to $2.17 trillion, its lowest…

15 hours ago

Apple Wave Analysis 3 July 2024

- Apple broke key resistance level 218.50 - Likely to rise to the resistance level…

1 day ago

FTSE 100 index Wave Analysis 3 July 2024

- FTSE 100 index reversed from key support level 8130.00 - Likely to rise to…

1 day ago

This website uses cookies