Categories: Technical analysis

AUDUSD Wave Analysis – 1 July, 2019

  • AUDUSD reversed from resistance area
  • Further losses are likely

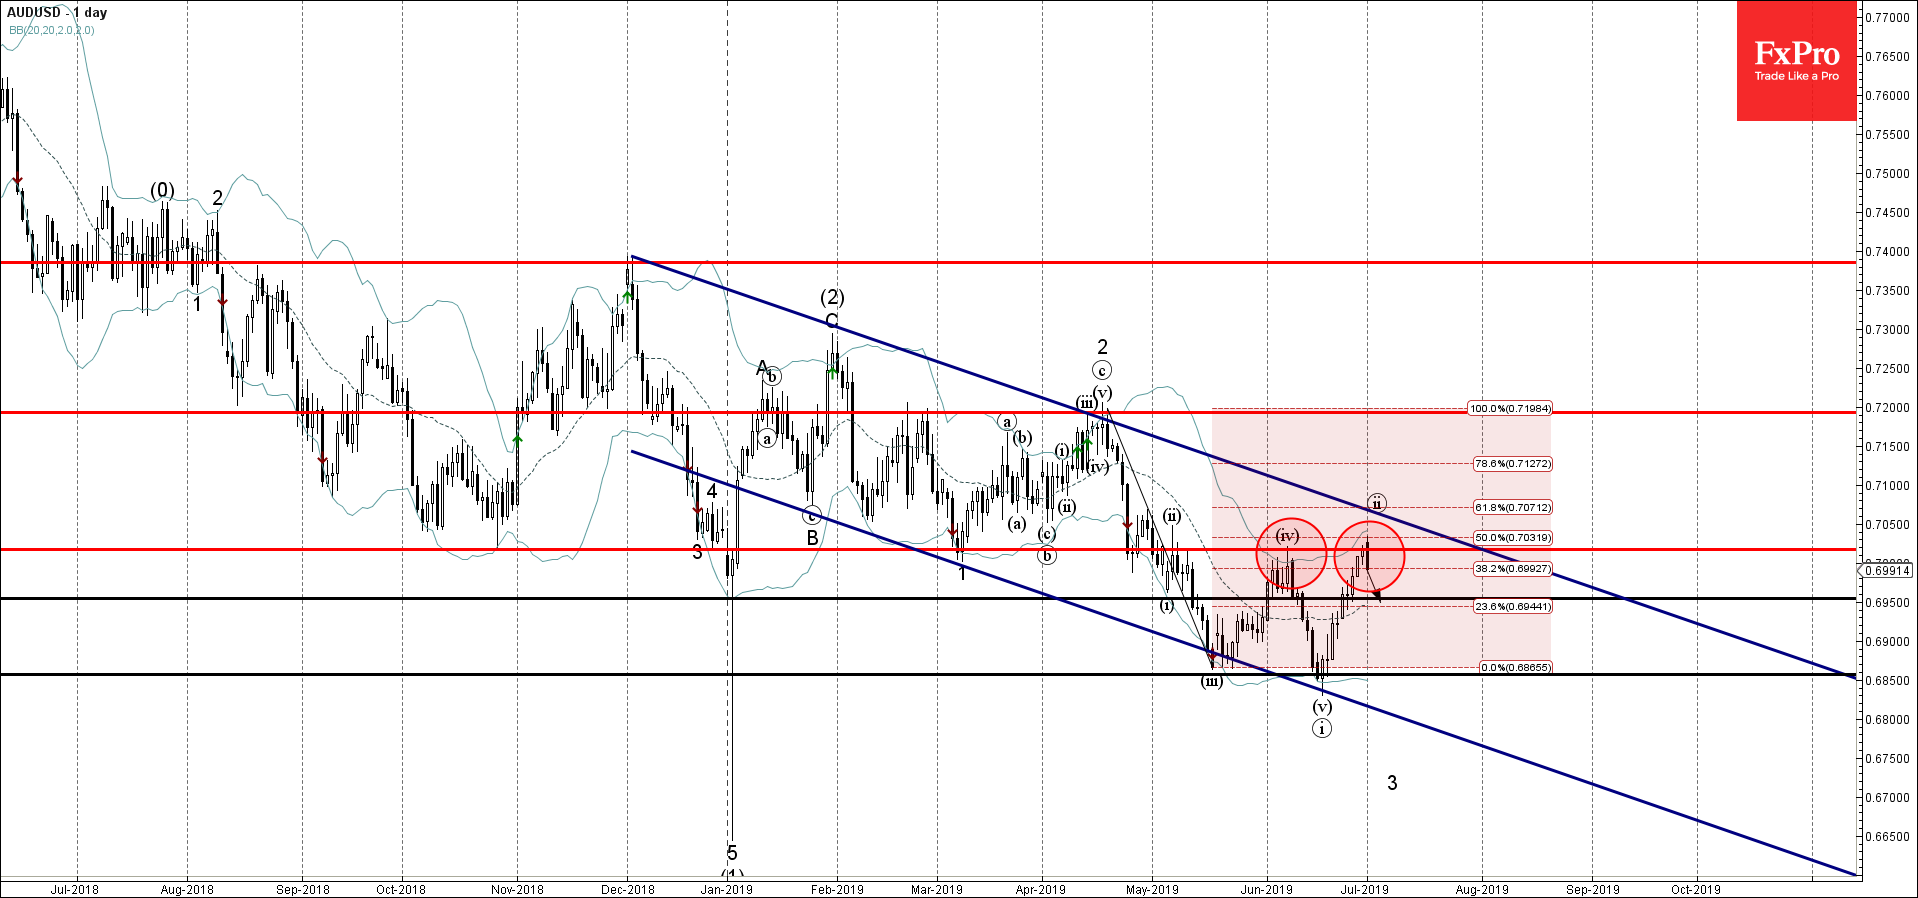
AUDUSD recently reversed down from the resistance area lying between the key resistance level 0.7020 (which also reversed the price in June) and the 50% Fibonacci correction of the previous downward impulse from April.

The aforementioned resistance area was further strengthened by the upper daily Bollinger Band.

AUDUSD is expected to fall further in the active daily impulse wave 3 and retest the next support level 0.6950 (former support from March).

AddThis Website Tools
The FxPro Tech Analysis Team

The FxPro technical experts prepare a daily analysis of the most active currency pairs (majors, crosses, exotics) and commodities. Selected instruments are reviewed on daily trends (D1, H4), using the active Elliott Wave setups, Japanese candlesticks, indicators, and support/resistance levels.

Share
Published by
The FxPro Tech Analysis Team
Tags: AUDUSD

Recent Posts

Amazon Wave Analysis – 24 March 2025

Amazon: ⬆️ Buy - Amazon reversed from the support zone - Likely to rise to…

8 hours ago

Brent crude oil Wave Analysis – 24 March 2025

Brent crude oil: ⬆️ Buy - Brent crude oil broke resistance zone - Likely to…

8 hours ago

USDJPY Wave Analysis – 24 March 2025

USDJPY: ⬆️ Buy - USDJPY broke the resistance zone - Likely to rise to the…

15 hours ago

Dow Jones Wave Analysis – 24 March 2025

Dow Jones: ⬆️ Buy - Dow Jones reversed from support zone - Likely to rise…

15 hours ago

Bitcoin pushes up from 200-day MA

Bitcoin pushed back from its 200-day low, with the crypto market capitalization rising to $2.86…

18 hours ago

Video: Market Shake-Up! Dollar, Bitcoin & Gold on the Move – What’s Next?

Big moves are brewing in the markets! 📉📈 The US Dollar is forming a bottom,…

24 hours ago