Categories: Technical analysis

AUDUSD Wave Analysis – 09 April, 2020

  • AUDUSD broke resistance area
  • Likely to rise to 0.6430

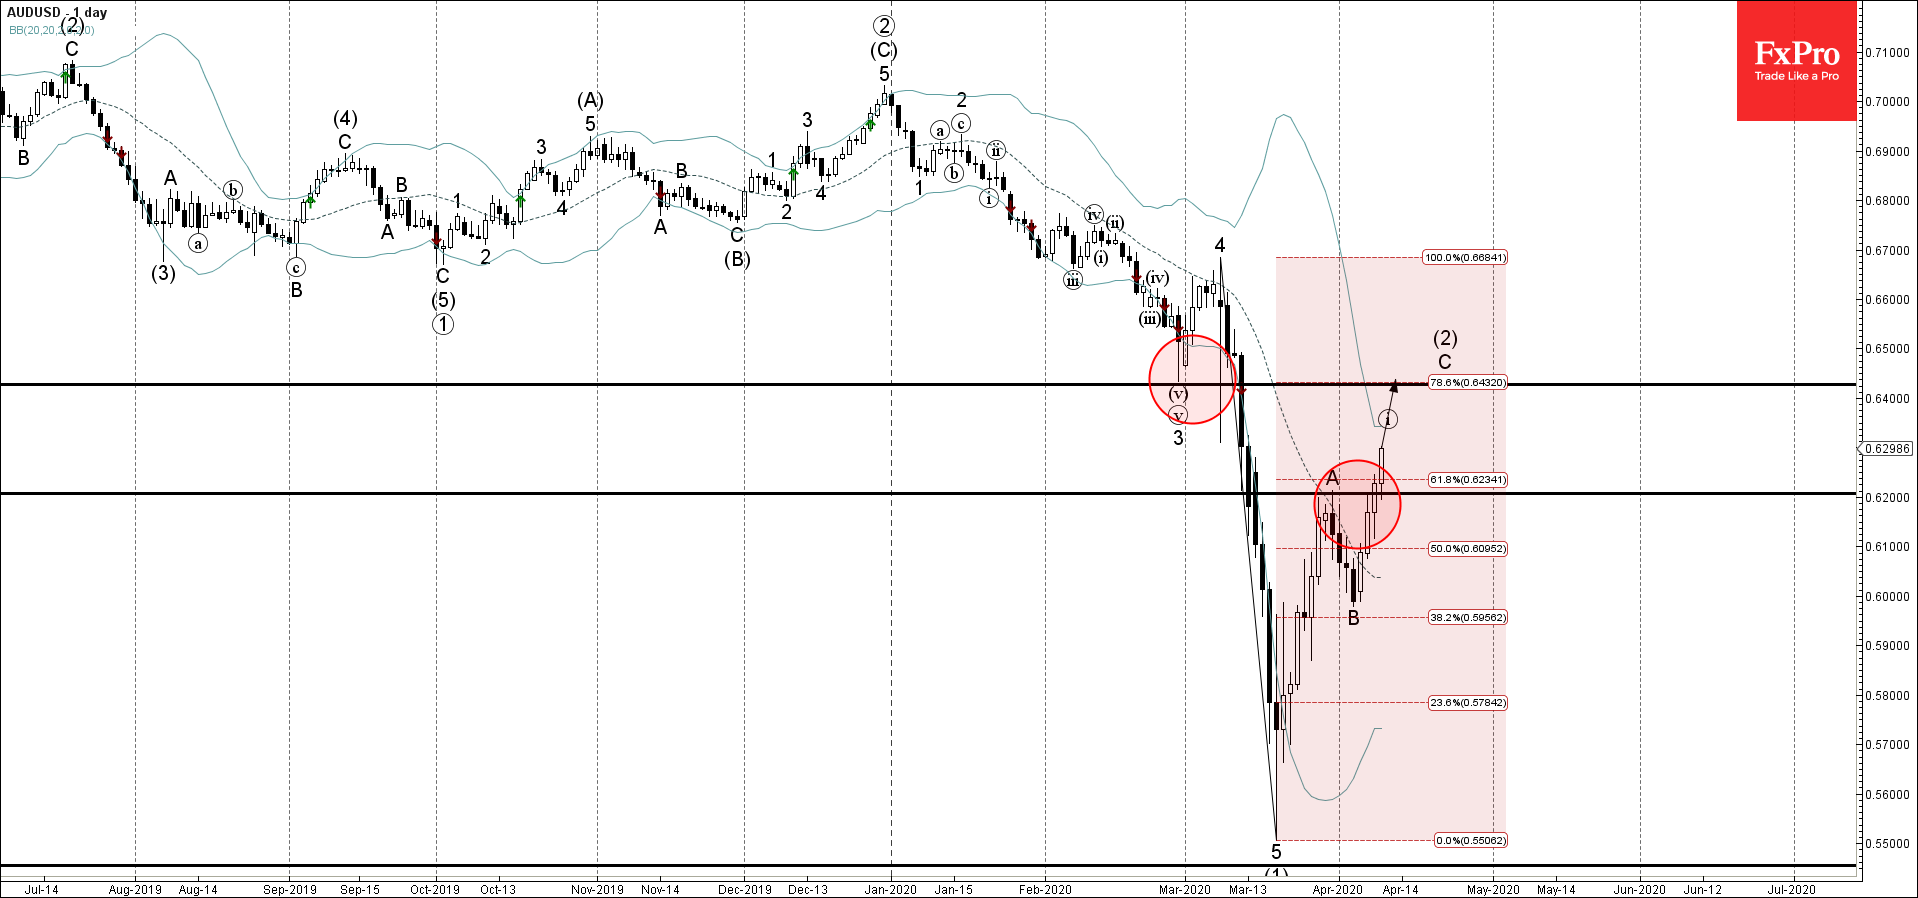
AUDUSD recently broke through resistance zone lying between the resistance level 0.6200 (which stopped the previous wave A in March) and the 61.8% Fibonacci correction of the previous sharp downward impulse 5 from last month.

The breakout of this resistance accelerated the active impulse wave C from the start of April – which belongs to ABC correction (2) from March.

AUDUSD is likely to rise further toward the next resistance level 0.6430 (former monthly low from February and the target for completion of wave C).

The FxPro Tech Analysis Team

The FxPro technical experts prepare a daily analysis of the most active currency pairs (majors, crosses, exotics) and commodities. Selected instruments are reviewed on daily trends (D1, H4), using the active Elliott Wave setups, Japanese candlesticks, indicators, and support/resistance levels.

Share
Published by
The FxPro Tech Analysis Team
Tags: AUDUSD

Recent Posts

Solana Wave Analysis – 5 December 2025

Solana: ⬇️ Sell - Solana reversed from resistance zone - Likely to fall to support…

7 minutes ago

EURAUD Wave Analysis – 5 December 2025

EURAUD : ⬇️ Sell - EURAUD broke the support level 1.7600 - Likely to fall…

8 minutes ago

Forex has set its priorities

In 2026, experts favour the yen, see modest euro growth, and expect pressure on the…

4 hours ago

Bear market rebound in crypto is likely to continue

Crypto rebounds continue; Bitcoin faces resistance, with a mixed market outlook ahead, as regulatory changes…

5 hours ago

Coca-Cola Wave Analysis – 4 December 2025

Coca-Cola: ⬇️ Sell - Coca-Cola reversed from long-term resistance level 73.25 - Likely to fall to…

19 hours ago

DraftKings Wave Analysis – 4 December 2025

DraftKings: ⬆️ Buy - DraftKings reversed from support zone - Likely to rise to resistance level…

19 hours ago

This website uses cookies