Categories: Technical analysis

AUDNZD Wave Analysis 8 January, 2021

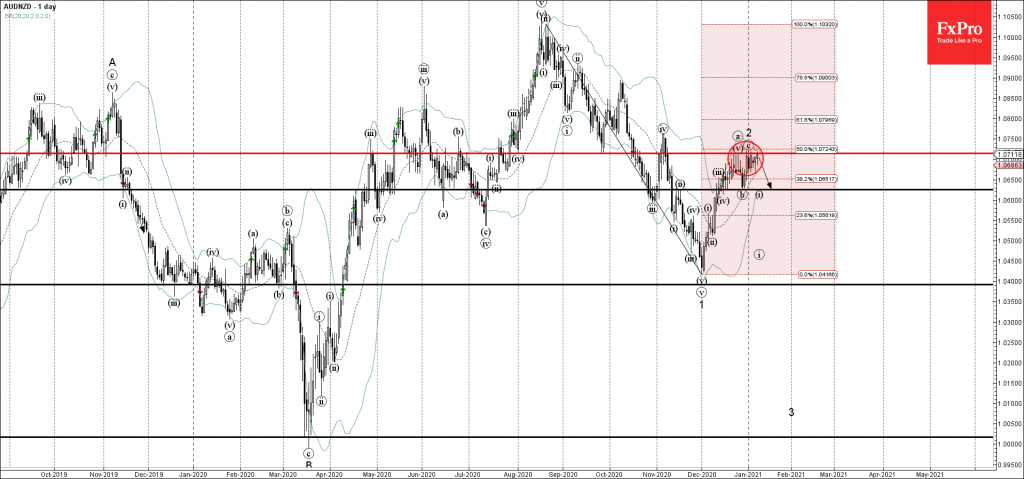
• AUDNZD approached key resistance level 1.0710

• Likely to fall to 1.0625

AUDNZD recently approached the key resistance level 1.0710 (which has been reversing the price from end of December), standing close to the upper daily Bollinger Band and the 50% Fibonacci correction of the downward impulse 1 from August.

The resistance level 1.0710 has been steadily reversing the price from the middle of December – stopped all previous intraday upward impulses.

AUDNZD is expected to fall further toward the next support level 1.0625 (low of wave (b) from the end of December).

The FxPro Tech Analysis Team

The FxPro technical experts prepare a daily analysis of the most active currency pairs (majors, crosses, exotics) and commodities. Selected instruments are reviewed on daily trends (D1, H4), using the active Elliott Wave setups, Japanese candlesticks, indicators, and support/resistance levels.

Share
Published by
The FxPro Tech Analysis Team
Tags: AUDNZD

Recent Posts

Brent Crude oil Wave Analysis – 13 January 2026

Brent Crude oil ⬆️ Buy - Brent Crude oil rising inside impulse wave c -…

9 hours ago

USDJPY Wave Analysis – 13 January 2026

USDJPY ⬆️ Buy - USDJPY broke resistance area - Likely to rise to resistance level…

9 hours ago

Exxon Mobil Wave Analysis – 13 January 2026

Exxon Mobil ⬆️ Buy - Exxon Mobil broke resistance level 125.60 - Likely to rise…

9 hours ago

BNB Wave Analysis – 13 January 2026

Brent Crude oil ⬆️ Buy - BNB broke out of sideways price range - Likely…

9 hours ago

A slightly weaker CPI was not enough to break through the highs

US CPI data a bit softer than forecasts, sparking brief market optimism, but resistance remains.…

14 hours ago

Pro News Flash: Global Tensions Fuel a Fresh Oil Rally

🛢️ Oil prices are finding fresh strength as geopolitical tensions in the Middle East reignite…

14 hours ago

This website uses cookies