Categories: Technical analysis

AUDNZD Wave Analysis – 6 June 2023

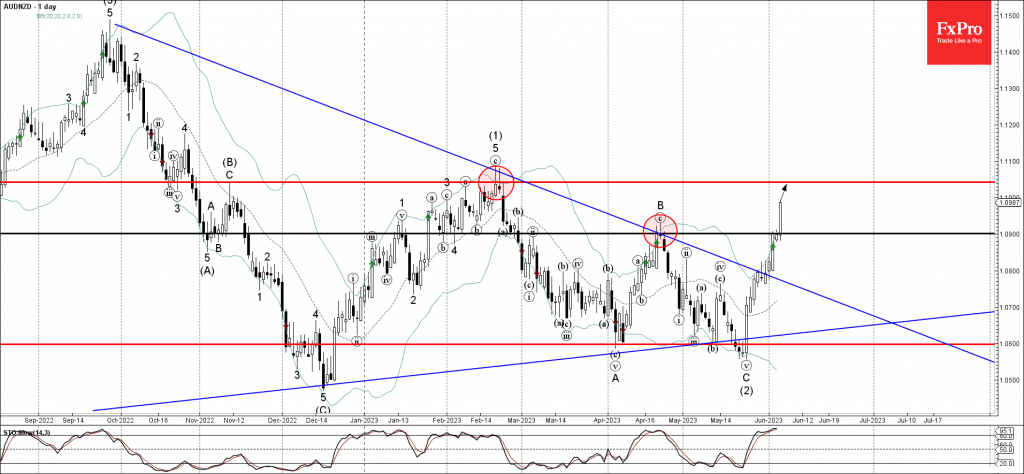
– AUDNZD broke resistance level 1,0900

– Likely to rise to resistance level 1.1045

AUDNZD under the bullish pressure after the price broke above the pivotal resistance level 1,0900 (which has been reversing the price from the start of March).

The breakout of the resistance level 1,0900 was preceded by the breakout of the weekly Triangle from last September.

AUDNZD can be expected to rise further toward the next resistance level 1.1045 (top of the previous waves (B) and (1)).

The FxPro Tech Analysis Team

The FxPro technical experts prepare a daily analysis of the most active currency pairs (majors, crosses, exotics) and commodities. Selected instruments are reviewed on daily trends (D1, H4), using the active Elliott Wave setups, Japanese candlesticks, indicators, and support/resistance levels.

Share
Published by
The FxPro Tech Analysis Team
Tags: AUDNZD

Recent Posts

Bitcoin Cash Wave Analysis – 12 January 2026

Bitcoin Cash: ⬇️ Sell - Bitcoin Cash reversed from resistance area - Likely to fall…

2 hours ago

EURJPY Wave Analysis – 12 January 2026

EURJPY: ⬆️ Buy - EURJPY reversed from support area - Likely to rise to resistance…

2 hours ago

Gold shines on an anti-fiat thesis

The dollar suffered due to threats to the Fed’s independence. Gold managed to renew its…

12 hours ago

SP500 Current situation #trading #tradelikeapro #sp500 #tradingshorts #tradingstrategy

Today is Monday, the 12th of January, and once again we will talk about the…

12 hours ago

Crypto: sell-the-growth continues

Crypto markets remain volatile; Bitcoin faces selling pressure, XRP slips, Monero surges, and market signals…

13 hours ago

CHFJPY Wave Analysis – 9 January 2026

CHFJPY: ⬆️ Buy - CHFJPY reversed from support area - Likely to rise to resistance…

3 days ago

This website uses cookies