Categories: Technical analysis

AUDNZD Wave Analysis 27 October, 2020

• AUDNZD broke support area

• Likely to fall to 1.0550

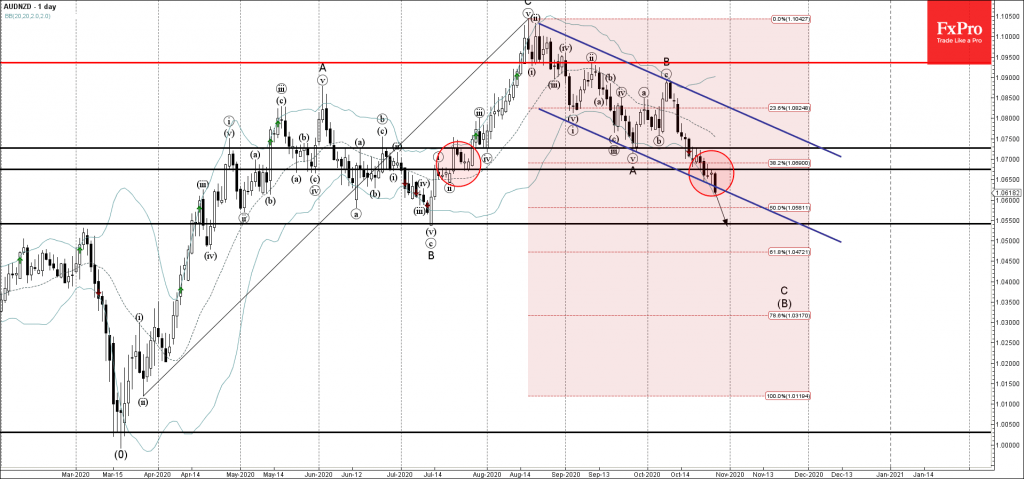
AUDNZD continues to fall after the earlier breakout of the support area lying between the key support level 1.0675, 38.2% Fibonacci correction of the upward impulse from March and the support trendline of the daily down channel from August.

The breakout of this support area accelerated the active short-term downward impulse wave C belonging to the ABC correction (B) from the middle of August.

AUDNZD is likely to fall further toward the next support level 1.0550 (former multi-month low from the start of July).

The FxPro Tech Analysis Team

The FxPro technical experts prepare a daily analysis of the most active currency pairs (majors, crosses, exotics) and commodities. Selected instruments are reviewed on daily trends (D1, H4), using the active Elliott Wave setups, Japanese candlesticks, indicators, and support/resistance levels.

Share
Published by
The FxPro Tech Analysis Team
Tags: AUDNZD

Recent Posts

USDJPY Wave Analysis 26 April 2024

- USDJPY broke key resistance level 155.00 - Likely to rise to resistance level 160.00…

1 day ago

Ebay Wave Analysis 26 April 2024

- Ebay reversed from support level 49.35 - Likely to rise to resistance level 52.55…

1 day ago

False Alert with Yen Interventions?

Even though the Bank of Japan left the key rate and parameters of the QE…

2 days ago

Cooler Bitcoin

Market picture  Market Dynamics: The cryptocurrency market stabilised, losing just 0.1% of capitalisation and dropping to…

2 days ago

GBPCAD Wave Analysis 25 April 2024

- GBPCAD reversed from key support level 1.6910 - Likely to rise to resistance level…

2 days ago

GBPAUD Wave Analysis 25 April 2024

- GBPAUD reversed from support level 1.9135 - Likely to rise to resistance level 1.9360…

2 days ago

This website uses cookies