Categories: Technical analysis

AUDNZD Wave Analysis 18 September, 2020

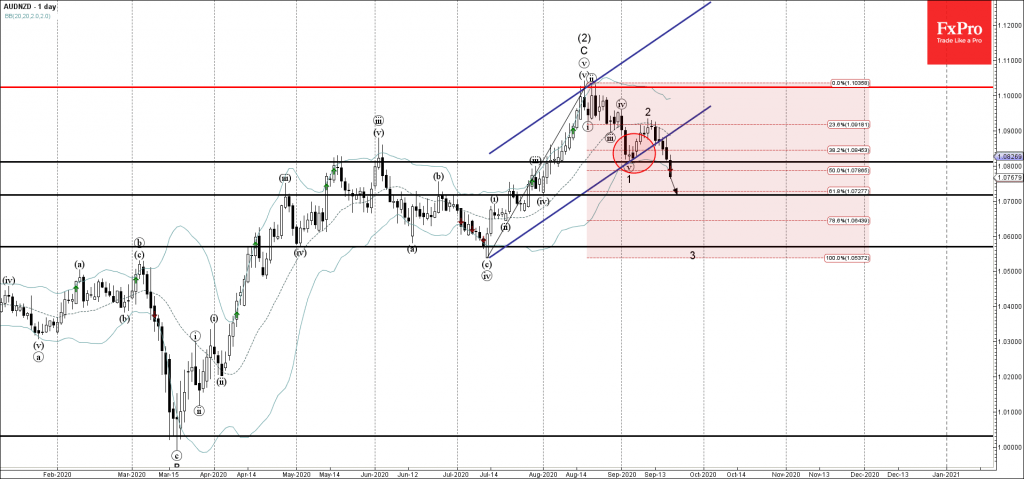
• AUDNZD under bearish pressure

• Likely to fall to 1.0720

AUDNZD under bearish pressure after the earlier breakout of the support zone set between the support level 1.0810 (low of the previous impose wave 1) and the 50% Fibonacci correction of the previous upward price move from July.

The breakout of the support zone follows the earlier breakout of the daily up channel from July.

AUDNZD is likely to fall further toward the next support level 1.0720 (low of the previous correction (iv) from the start of August).

The FxPro Tech Analysis Team

The FxPro technical experts prepare a daily analysis of the most active currency pairs (majors, crosses, exotics) and commodities. Selected instruments are reviewed on daily trends (D1, H4), using the active Elliott Wave setups, Japanese candlesticks, indicators, and support/resistance levels.

Share
Published by
The FxPro Tech Analysis Team
Tags: AUDNZD

Recent Posts

Crypto market shakes off consolidation

Market picture The release of US inflation data sparked a surge in risk asset purchases,…

3 hours ago

Gold Wave Analysis – 15 May, 2024

• Gold broke daily down channel • Likely to reach resistance level 2415.00 Gold recently…

20 hours ago

AUDUSD Wave Analysis – 15 May, 2024

• AUDUSD broke key resistance level 0.6650 • Likely to reach resistance level 0.6760 AUDUSD…

20 hours ago

EURUSD is trying to break the 5-month downtrend

The US dollar has been under relentless pressure since last Thursday, approaching more than one-month…

22 hours ago

Matured altcoins are losing strength

Market Picture Neither the meme mania in equities, the overall positivity in stock indices, nor…

1 day ago

EURCHF Wave Analysis – 14 May, 2024

• EURCHF rising inside impulse wave 3 • Likely to reach resistance level 0.9835 EURCHF…

2 days ago

This website uses cookies