Categories: Technical analysis

AUDNZD Wave Analysis – 17 April, 2020

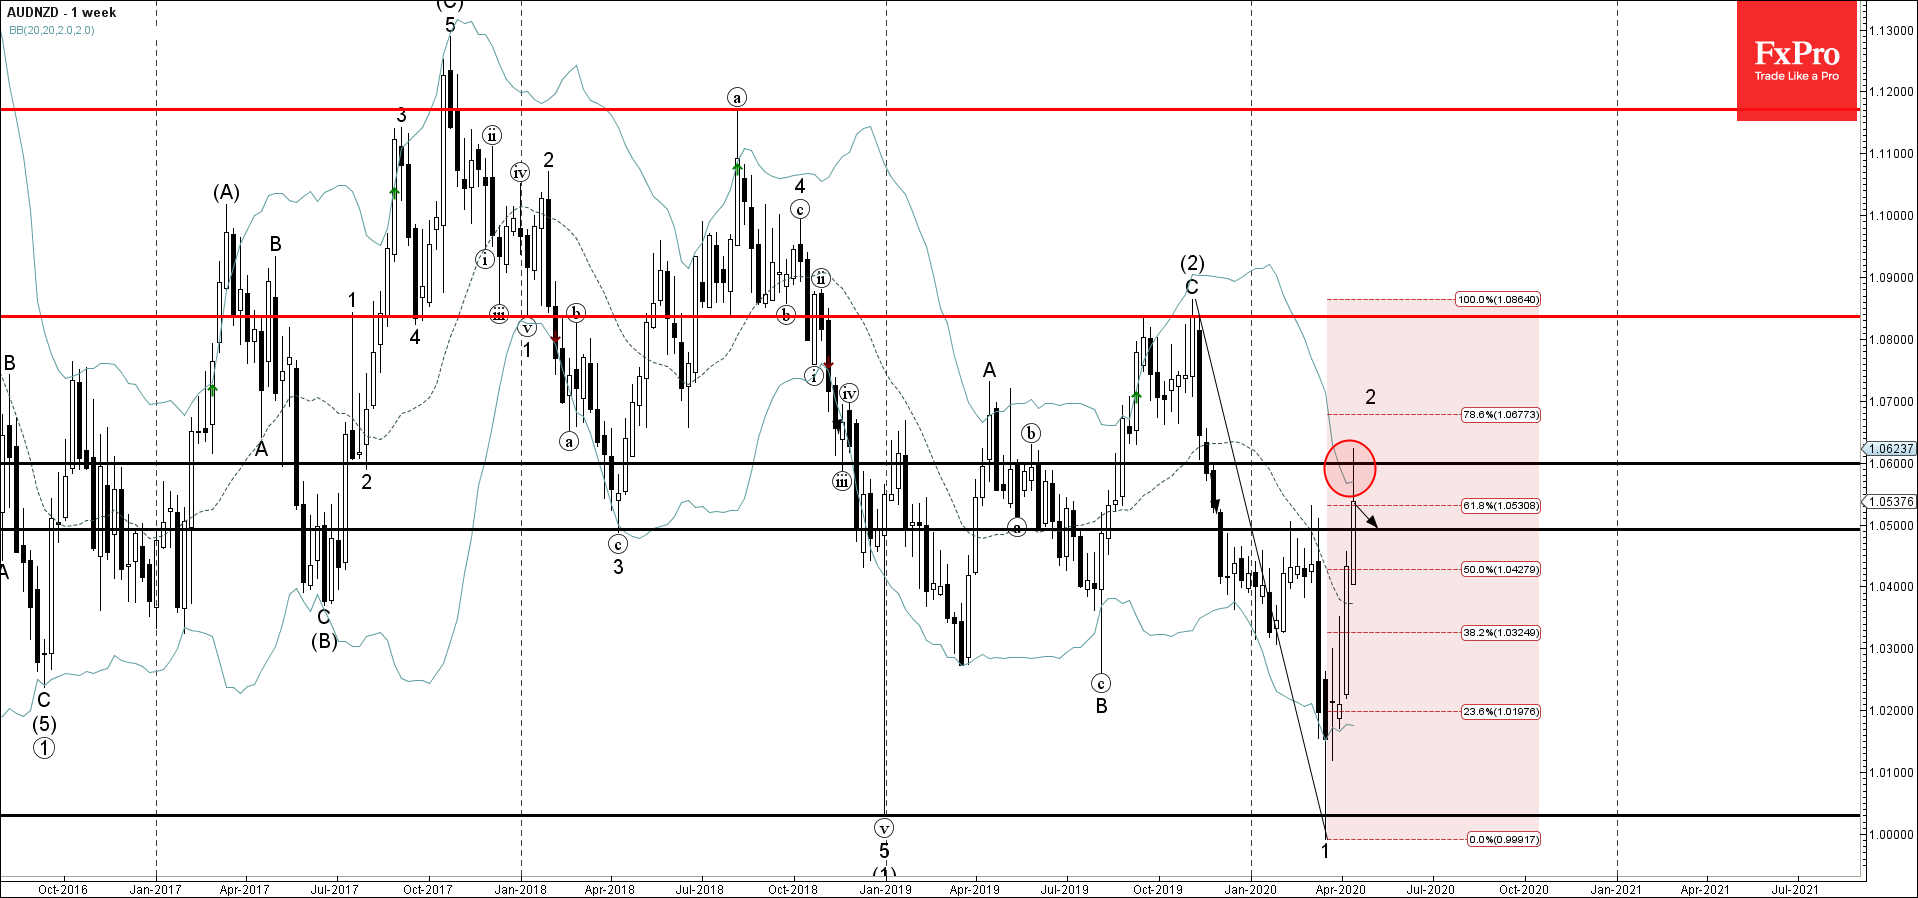
  • AUDNZD reversed from resistance level 1.0600
  • Likely to fall to 1.0500

AUDNZD recently reversed down from the round resistance level 1.0600 – standing near the weekly upper Bollinger Band.

The downward reversal from the resistance level 1.0600 stopped the previous short-term corrective wave 2 from  the end of March.

Given the clear multiyear downtrend that can be seen on the weekly AUDNZD charts – AUDNZD is expected to fall further toward the next support level 1.0500 (former key resistance from the start of 2020).

AddThis Website Tools
The FxPro Tech Analysis Team

The FxPro technical experts prepare a daily analysis of the most active currency pairs (majors, crosses, exotics) and commodities. Selected instruments are reviewed on daily trends (D1, H4), using the active Elliott Wave setups, Japanese candlesticks, indicators, and support/resistance levels.

Share
Published by
The FxPro Tech Analysis Team
Tags: AUDNZD

Recent Posts

Virgin Galactic Wave Analysis – 26 March 2025

Virgin Galactic: ⬇️ Sell - Virgin Galactic reversed from the resistance area - Likely to…

7 hours ago

GBPUSD Wave Analysis – 26 March 2025

GBPUSD: ⬇️ Sell - GBPUSD reversed from resistance area - Likely to fall to support…

7 hours ago

No need to fear the death cross in BTC

The crypto market experienced a slight increase but remains below the 200-day MA. Bitcoin is…

14 hours ago

WTI crude oil Wave Analysis – 26 March 2025

WTI crude oil: ⬆️ Buy - WTI crude oil broke resistance area - Likely to…

15 hours ago

GBPCAD Wave Analysis – 26 March 2025

GBPCAD: ⬇️ Sell - GBPCAD reversed from resistance zone - Likely to fall to support…

15 hours ago

UK Inflation Cools Down Pound

UK CPI was weaker than expected, with the annual rate slowing to 2.8%. This may…

17 hours ago