Categories: Technical analysis

AUDNZD Wave Analysis 1 April, 2021

• AUDNZD reversed from resistance area

• Likely to fall to support level 1.08150

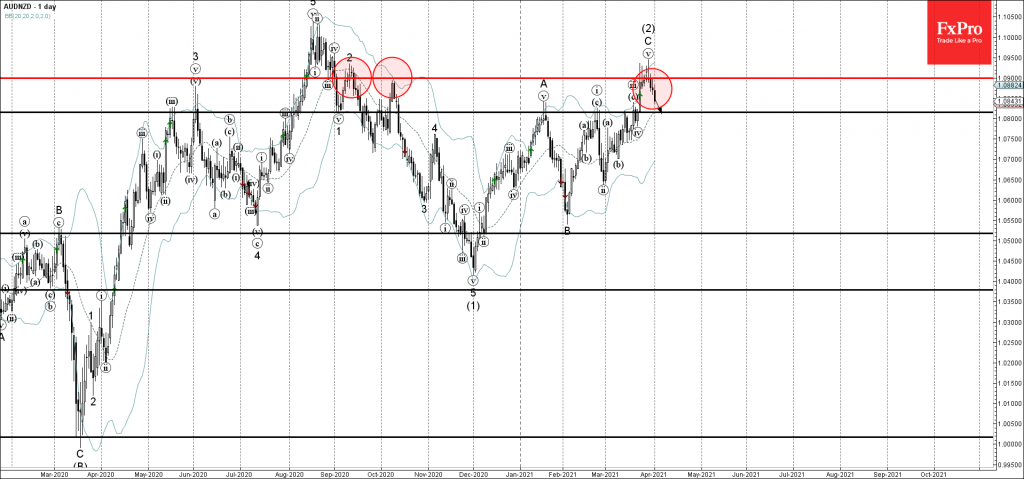
AUDNZD recently reversed down from the resistance area located between the resistance level 1.0900 (strong barrier from September of 2020) and the upper daily Bollinger Band.

The downward reversal from this resistance area created the daily reversal pattern Shooting Star.

AUDNZD is likely to fall in the active impulse wave (3) toward the next support level 1.08150 (former resistance from the start of March).

The FxPro Tech Analysis Team

The FxPro technical experts prepare a daily analysis of the most active currency pairs (majors, crosses, exotics) and commodities. Selected instruments are reviewed on daily trends (D1, H4), using the active Elliott Wave setups, Japanese candlesticks, indicators, and support/resistance levels.

Share
Published by
The FxPro Tech Analysis Team
Tags: AUDNZD

Recent Posts

Bitcoin Wave Analysis – 14 January 2026

Bitcoin: ⬆️ Buy - Bitcoin broke resistance area - Likely to rise to resistance level…

4 hours ago

NZDJPY Wave Analysis – 14 January 2026

NZDJPY: ⬇️ Sell - NZDJPY reversed down from the resistance area - Likely to fall…

4 hours ago

What is Leverage?

Leverage is a mechanism that lets traders control larger positions using smaller capital. By choosing…

9 hours ago

The dollar does not tolerate dissent

US GDP growth is driven not by the White House, but by AI. The Bank…

15 hours ago

The crypto market has made a breakthrough

The crypto market surges, hitting new highs, with bullish sentiment for Bitcoin and Ethereum amid…

15 hours ago

Brent Crude oil Wave Analysis – 13 January 2026

Brent Crude oil ⬆️ Buy - Brent Crude oil rising inside impulse wave c -…

1 day ago

This website uses cookies