Categories: Technical analysis

AUDNZD Wave Analysis – 07 August, 2019

  • AUDNZD reversed from support zone
  • Further gains are likely

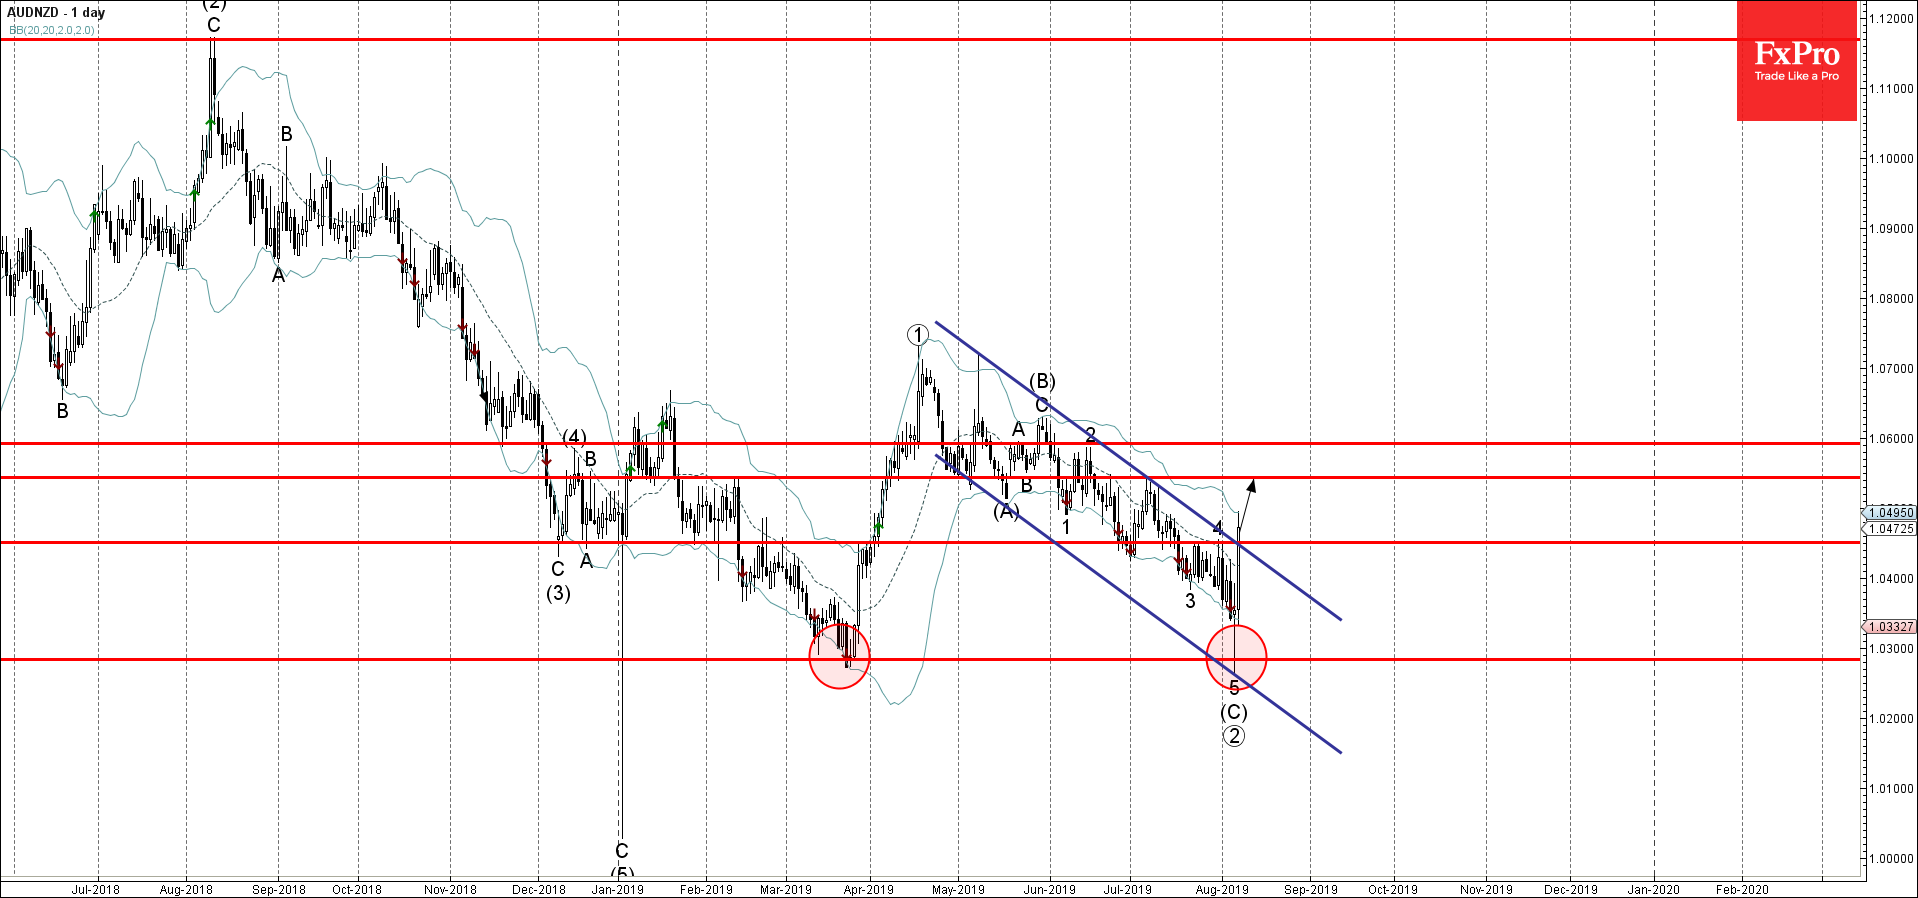
AUDNZD recently reversed up sharply from the support zone lying between the round support level 1.0300 and the lower daily Bollinger Band.

The price today broke the resistance trendline of the daily down channel from April – intersecting with the resistance level 1.0450.

AUDNZD is expected to rise further and retest the next resistance level 1.0545 (monthly high from July).

The FxPro Tech Analysis Team

The FxPro technical experts prepare a daily analysis of the most active currency pairs (majors, crosses, exotics) and commodities. Selected instruments are reviewed on daily trends (D1, H4), using the active Elliott Wave setups, Japanese candlesticks, indicators, and support/resistance levels.

Share
Published by
The FxPro Tech Analysis Team
Tags: AUDNZD

Recent Posts

Silver: a possible long road down  

Silver has lost 2.6% since the start of the day on Tuesday to $26.4 per…

39 mins ago

Another Dip in Crypto Capitalization

Market picture  The crypto market capitalisation decreased by another 1.5% to $2.27 trillion, getting closer…

4 hours ago

ANF Wave Analysis 29 April 2024

ANF reversed from key support level 113.40 Likely to rise to resistance level 132.31 ANF…

20 hours ago

GBPUSD Wave Analysis 29 April 2024

- GBPUSD rising inside minor correction 2 - Likely to rise to resistance level 1.2700…

20 hours ago

Crypto Market Retreats Due to Overhang of Sellers

Market picture The crypto market has lost 3.3% in the last 24 hours to $2.3…

1 day ago

USDJPY Wave Analysis 26 April 2024

- USDJPY broke key resistance level 155.00 - Likely to rise to resistance level 160.00…

4 days ago

This website uses cookies