Categories: Technical analysis

AUDNZD Wave Analysis – 02 April, 2020

  • AUDNZD reversed from round resistance level 1.0300
  • Likely to fall to 1.0200

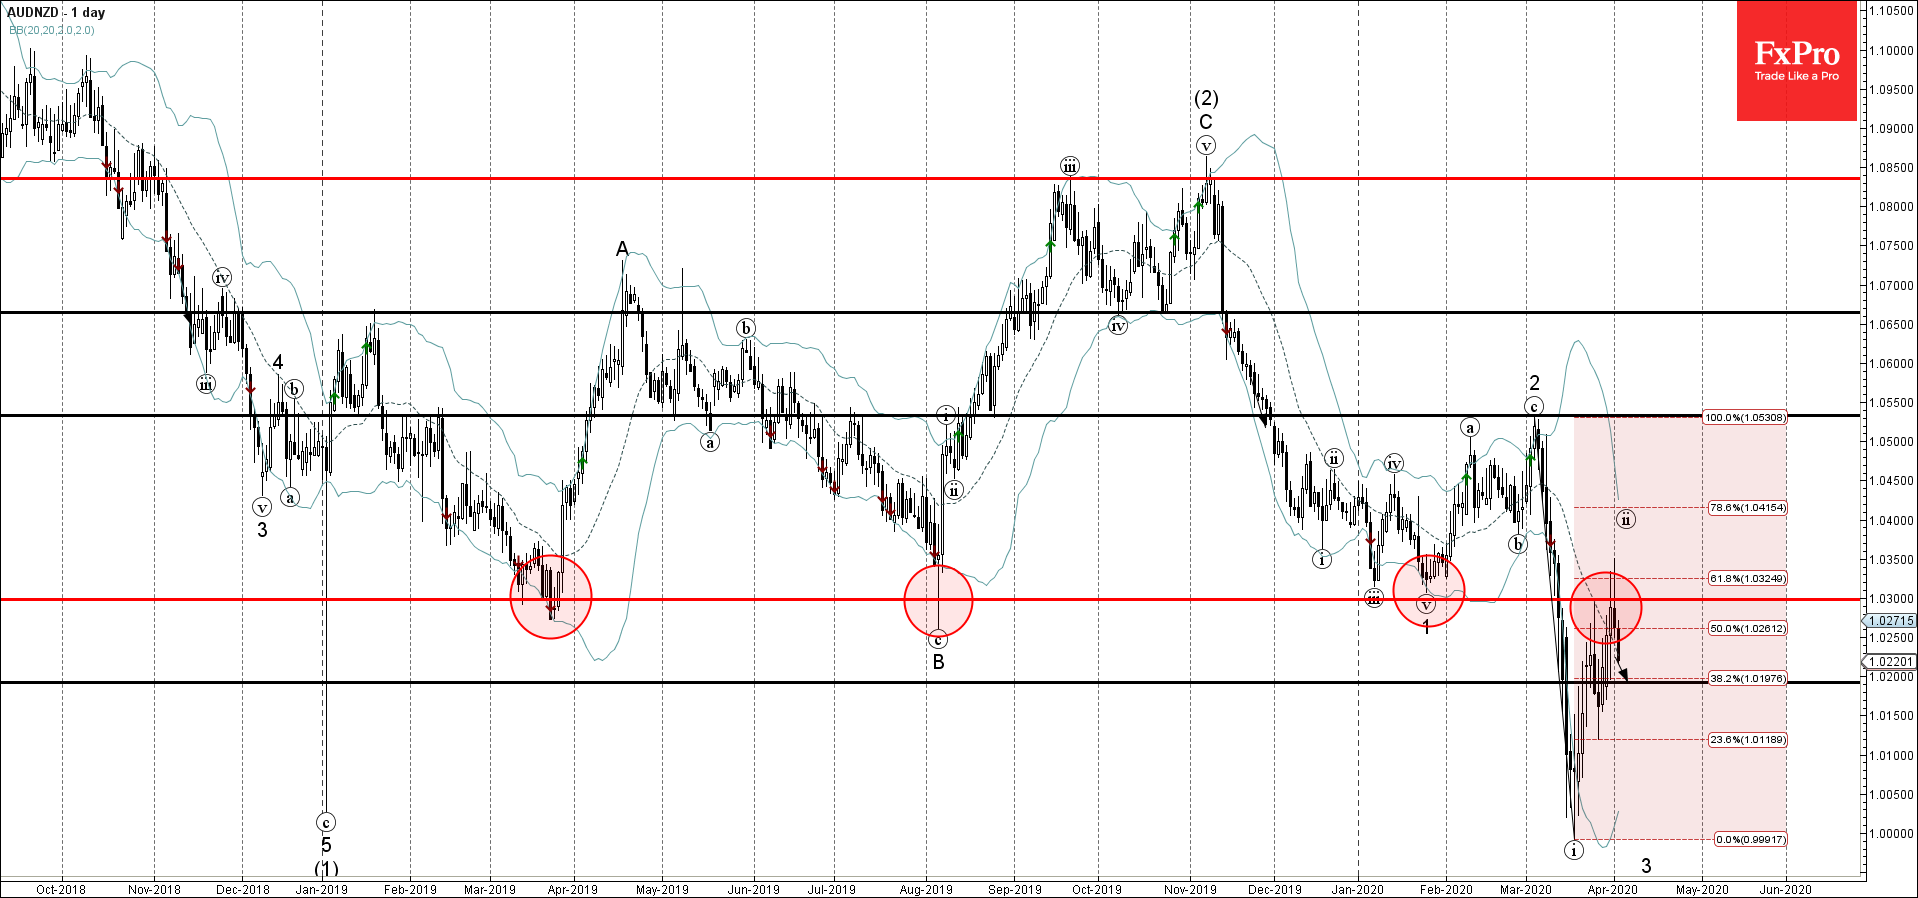
AUDNZD recently reversed down from the round resistance level 1.0300 (former strong support from 2019), intersecting with the 61,8% Fibonacci correction of the previous downward impulse from the start of March.

The downward reversal from this resistance area created the daily candlesticks reversal pattern Shooting Star.

Give the strength of the daily downtrend from last November – AUDNZD is likely to fall further toward the next support level 1.0200.

AddThis Website Tools
The FxPro Tech Analysis Team

The FxPro technical experts prepare a daily analysis of the most active currency pairs (majors, crosses, exotics) and commodities. Selected instruments are reviewed on daily trends (D1, H4), using the active Elliott Wave setups, Japanese candlesticks, indicators, and support/resistance levels.

Share
Published by
The FxPro Tech Analysis Team
Tags: AUDNZD

Recent Posts

Tesla Wave Analysis – 21 March 2025

Tesla: ⬆️ Buy - Tesla reversed from support level 220.00 - Likely to rise to…

15 hours ago

Google Wave Analysis – 21 March 2025

Google: ⬆️ Buy - Google reversed from key support level 160.00 - Likely to rise…

15 hours ago

Silver Wave Analysis – 21 March 2025

Silver: ⬇️ Sell - Silver reversed from resistance level 34.00 - Likely to fall to…

16 hours ago

USDCHF Wave Analysis – 21 March 2025

USDCHF: ⬆️ Buy - USDCHF reversed from support level 0,8750 - Likely to fall to…

16 hours ago

What’s next: Flash PMIs, UK CPI & US PCE

The week ahead includes the release of the PMI business activity indexes for March, the…

23 hours ago

Gold: Growth Opportunities

Gold has been in an uptrend, reaching record highs and offering growth opportunities. However, caution…

23 hours ago