Categories: Technical analysis

AUDJPY Wave Analysis – 26 October , 2018

  • AUDJPY reversed from key support area
  • Further gains are likely

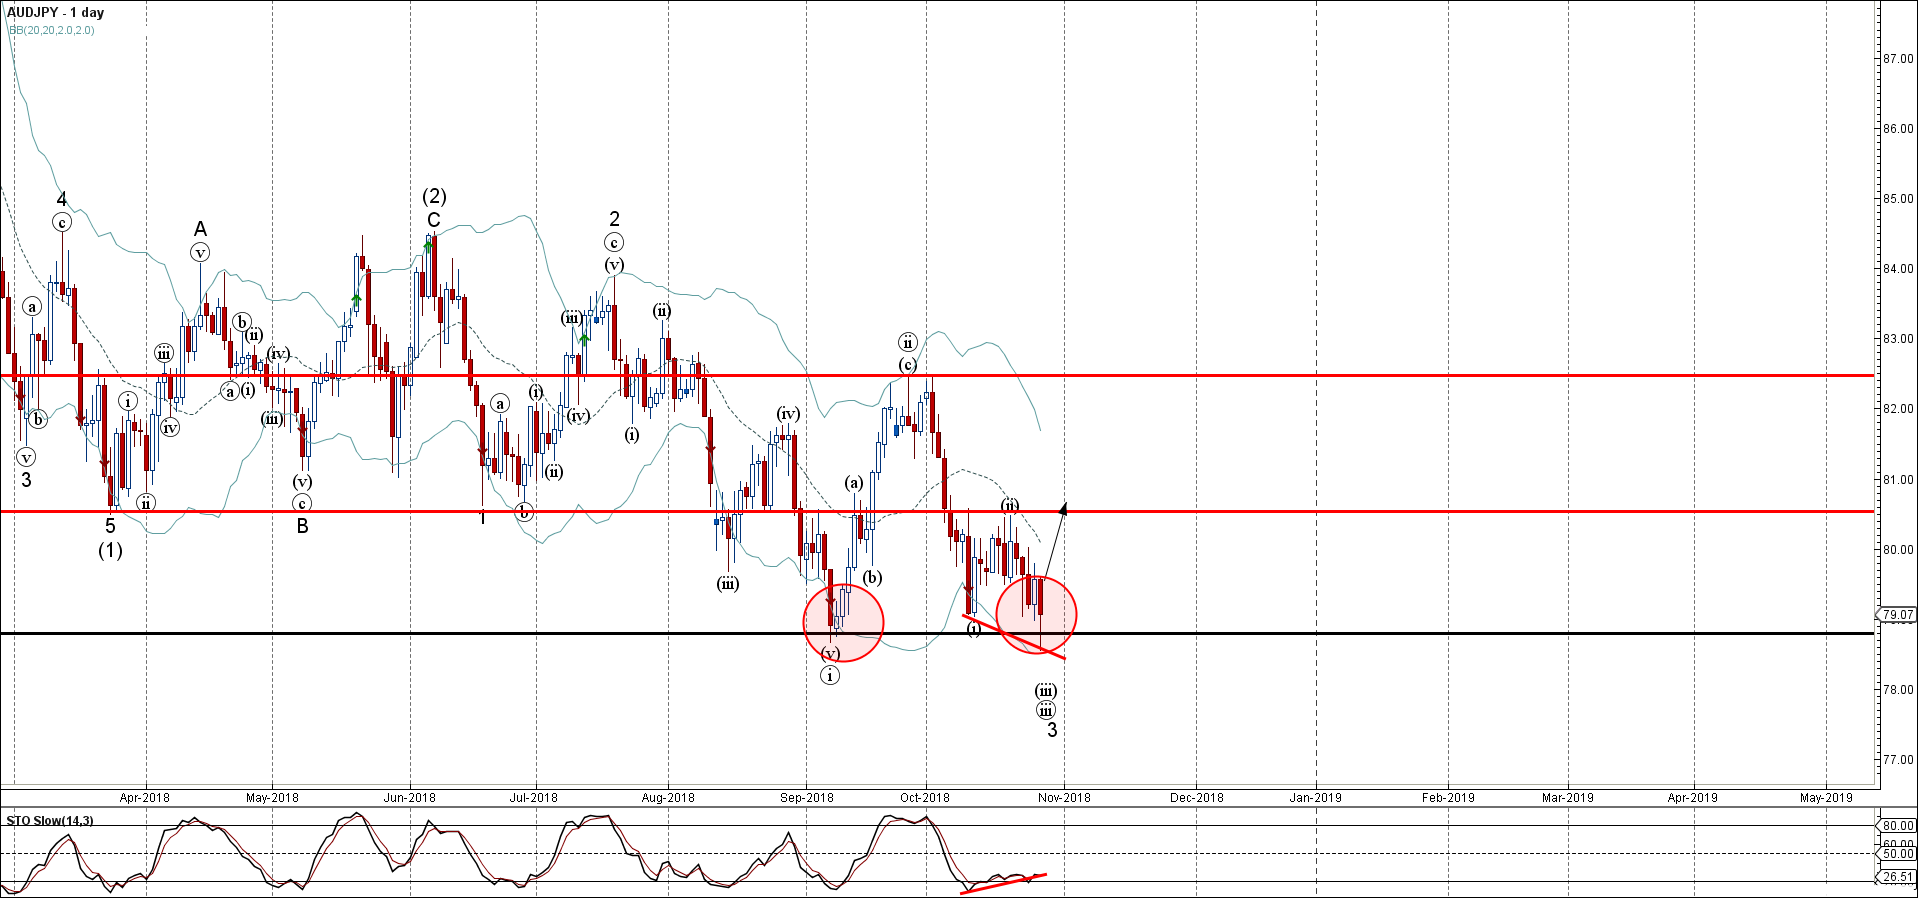
AUDJPY today reversed up from the key support area lying at the intersection of the strong support level 78.730 (which stopped the extended downtrend in September) and the lower daily Bollinger Band.

The upward reversal from this support area stopped the earlier short-term impulse wave 3 – which belongs to the longer-term impulse wave (3) from June.

Given the bullish divergence on the daily Stochastic indicator – AUDJPY is expected to rise further and re-test the next strong resistance level 80.50 (top of the previous correction (ii)).

The FxPro Tech Analysis Team

The FxPro technical experts prepare a daily analysis of the most active currency pairs (majors, crosses, exotics) and commodities. Selected instruments are reviewed on daily trends (D1, H4), using the active Elliott Wave setups, Japanese candlesticks, indicators, and support/resistance levels.

Share
Published by
The FxPro Tech Analysis Team
Tags: AUDJPY

Recent Posts

Adobe Wave Analysis 3 May 2024

- Adobe reversed from support zone - Likely to rise to resistance level 500.00 Adobe…

5 hours ago

EURGBP Wave Analysis 3 May 2024

- EURJPY reversed from support zone - Likely to rise to resistance level 0.8625 EURGBP…

5 hours ago

How Low Can the USDJPY Go?

USDJPY was slipping below 153 on Friday morning, a three-week low and having lost over…

11 hours ago

Bitcoin’s Downtrend, Solana and Ethereum Form Double Bottom

Market picture  Crypto market capitalisation rose 3.3% in 24 hours to $2.22 trillion. Local capitalisation…

17 hours ago

EURJPY Wave Analysis 2 May 2024

- EURJPY under strong bearish pressure - Likely to fall to support level 163.10 EURJPY…

1 day ago

WTI crude oil Wave Analysis 2 May 2024

- WTI broke round support level 80.00 - Likely to fall to support level 76.00…

1 day ago

This website uses cookies