Categories: Technical analysis

AUDJPY Wave Analysis – 19 September, 2019

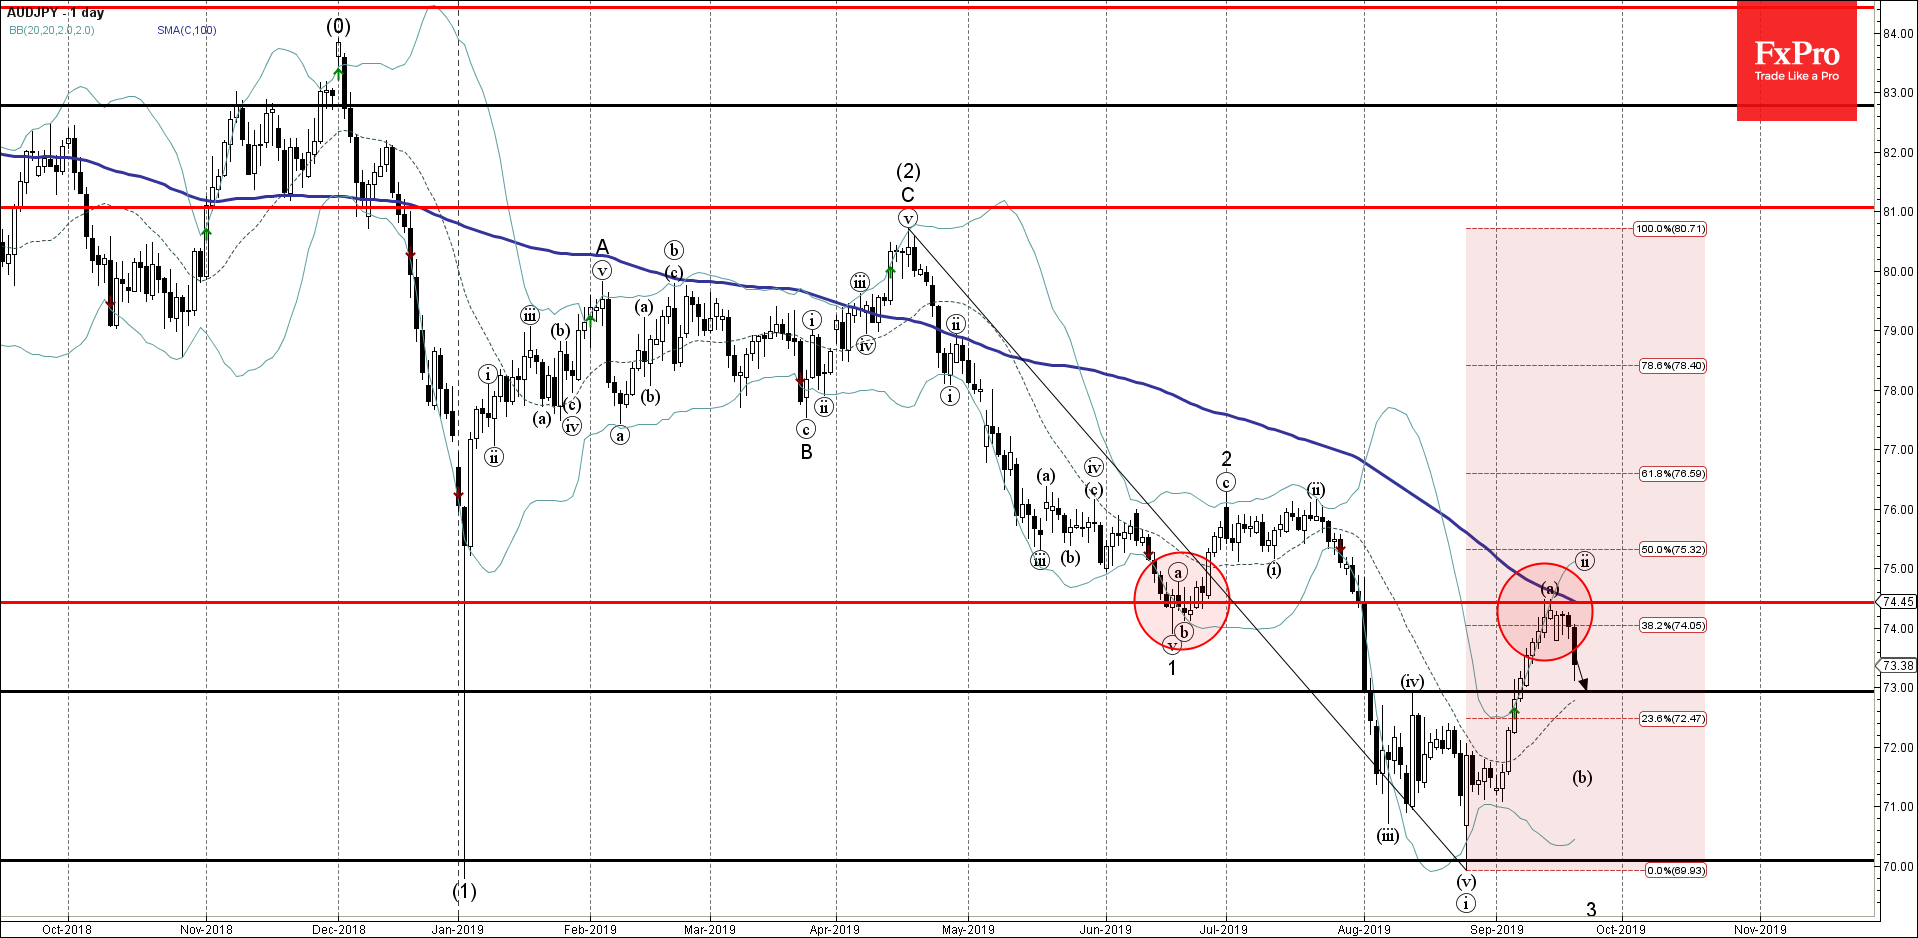
  • AUDJPY reversed from resistance zone
  • Likely to correct down to 73.00

AUDJPY recently reversed down from the resistance area lying between the resistance level 74.50 (former support from June), upper daily Bollinger Band, 100-day moving average and the 38.2% Fibonacci correction of the previous downward impulse from April.

This downward reversal started the active short-term corrective wave (b)  – which belongs to the ABC correction (ii) from last month.

AUDJPY is expected to fall further and retest the next strong support level 73.00 (top of the previous corrective wave (iv) from August).

AddThis Website Tools
The FxPro Tech Analysis Team

The FxPro technical experts prepare a daily analysis of the most active currency pairs (majors, crosses, exotics) and commodities. Selected instruments are reviewed on daily trends (D1, H4), using the active Elliott Wave setups, Japanese candlesticks, indicators, and support/resistance levels.

Share
Published by
The FxPro Tech Analysis Team
Tags: AUDJPY

Recent Posts

Apple Wave Analysis – 16 April 2025

Apple: ⬇️ Sell - Apple reversed from resistance level 210.00 - Likely to fall to…

4 hours ago

AUDCAD Wave Analysis – 16 April 2025

AUDCAD: ⬇️ Sell - AUDCAD reversed from resistance zone - Likely to fall to support…

4 hours ago

US sales jump gives USD relief, but is driven by fears

US Total retail sales rose 1.4% in March, beating the expected 1.3% after rising 0.2%…

11 hours ago

Tariff news and resistance zone put pressure on crypto

The crypto market capitalisation decreased by 2.6% in 24 hours due to the announcement of…

15 hours ago

Gold Wave Analysis – 16 April 2025

Gold: ⬆️ Buy - Gold broke resistance zone - Likely to rise to the resistance…

18 hours ago

GBPUSD Wave Analysis – 16 April 2025

GBPUSD: ⬆️ Buy - GBPUSD broke key resistance level 1.3200 - Likely to rise to…

19 hours ago