Categories: Technical analysis

AUDCHF Wave Analysis – 7 April 2023

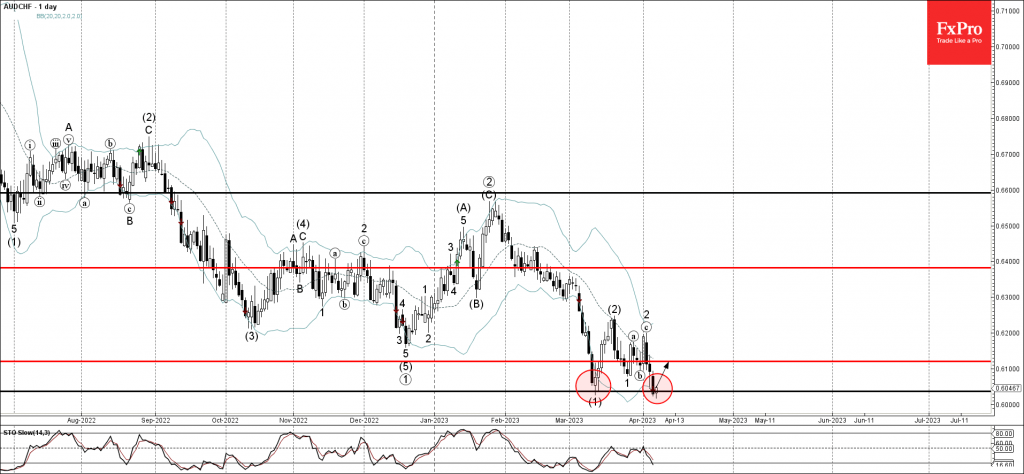
• AUDCHF reversed from strong support level 0.6035

• Likely to rise to resistance level 0.6120

AUDCHF recently reversed up from the strong support level 0.6035 (which stopped the previous intermediate impulse wave (1) in March) intersecting with the lower daily Bollinger Band.

The upward reversal from the support level 0.6035 stopped the previous short-term impulse wave 3 – which is a part of the higher order downward impulse wave (3) from last month.

Given the strength of the support level 0.6035 and the clear bullish divergence on the daily Stochastic, AUDCHF can then be expected to rise further toward the next resistance level 0.6120.

The FxPro Tech Analysis Team

The FxPro technical experts prepare a daily analysis of the most active currency pairs (majors, crosses, exotics) and commodities. Selected instruments are reviewed on daily trends (D1, H4), using the active Elliott Wave setups, Japanese candlesticks, indicators, and support/resistance levels.

Share
Published by
The FxPro Tech Analysis Team
Tags: AUDCHF

Recent Posts

Adobe Wave Analysis 3 May 2024

- Adobe reversed from support zone - Likely to rise to resistance level 500.00 Adobe…

3 hours ago

EURGBP Wave Analysis 3 May 2024

- EURJPY reversed from support zone - Likely to rise to resistance level 0.8625 EURGBP…

3 hours ago

How Low Can the USDJPY Go?

USDJPY was slipping below 153 on Friday morning, a three-week low and having lost over…

10 hours ago

Bitcoin’s Downtrend, Solana and Ethereum Form Double Bottom

Market picture  Crypto market capitalisation rose 3.3% in 24 hours to $2.22 trillion. Local capitalisation…

15 hours ago

EURJPY Wave Analysis 2 May 2024

- EURJPY under strong bearish pressure - Likely to fall to support level 163.10 EURJPY…

1 day ago

WTI crude oil Wave Analysis 2 May 2024

- WTI broke round support level 80.00 - Likely to fall to support level 76.00…

1 day ago

This website uses cookies