Categories: Technical analysis

AUDCHF Wave Analysis 28 September, 2020

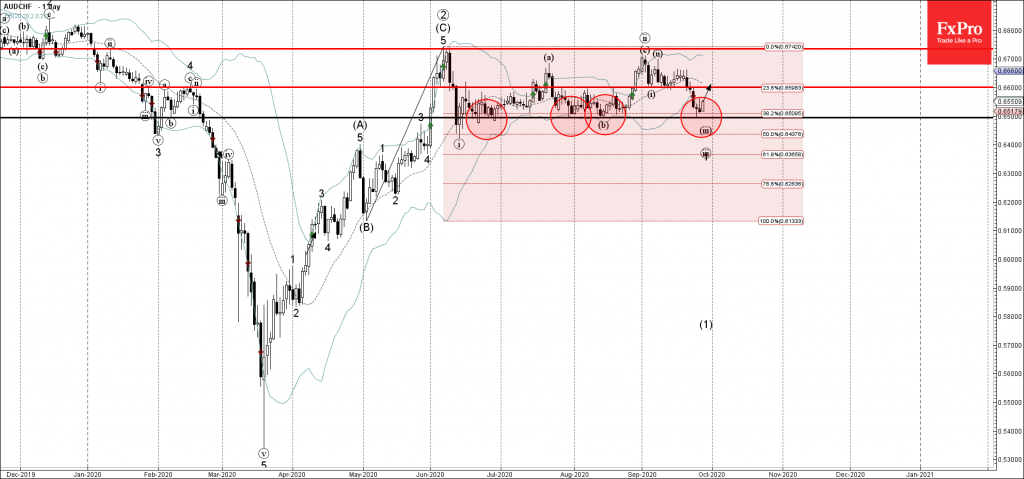
• AUDCHF reversed from support level 0.6500

• Likely to rise to 0.6600

AUDCHF recently reversed up from the support area lying between the strong support level 0.6500 (which has been steadily reversing the price from the middle of June), lower daily Bollinger Band and the 38.2% Fibonacci correction of the upward impulse (C) from May.

The upward reversal from the aforementioned support area created the daily Japanese candlesticks reversal pattern Hammer.

AUDCHF is expected to rise further toward the next resistance level 0.6600 (former support from the first half of September).

The FxPro Tech Analysis Team

The FxPro technical experts prepare a daily analysis of the most active currency pairs (majors, crosses, exotics) and commodities. Selected instruments are reviewed on daily trends (D1, H4), using the active Elliott Wave setups, Japanese candlesticks, indicators, and support/resistance levels.

Share
Published by
The FxPro Tech Analysis Team

Recent Posts

USDJPY Wave Analysis 26 April 2024

- USDJPY broke key resistance level 155.00 - Likely to rise to resistance level 160.00…

21 hours ago

Ebay Wave Analysis 26 April 2024

- Ebay reversed from support level 49.35 - Likely to rise to resistance level 52.55…

21 hours ago

False Alert with Yen Interventions?

Even though the Bank of Japan left the key rate and parameters of the QE…

1 day ago

Cooler Bitcoin

Market picture  Market Dynamics: The cryptocurrency market stabilised, losing just 0.1% of capitalisation and dropping to…

1 day ago

GBPCAD Wave Analysis 25 April 2024

- GBPCAD reversed from key support level 1.6910 - Likely to rise to resistance level…

2 days ago

GBPAUD Wave Analysis 25 April 2024

- GBPAUD reversed from support level 1.9135 - Likely to rise to resistance level 1.9360…

2 days ago

This website uses cookies