Categories: Technical analysis

AUDCHF Wave Analysis – 25 February, 2019

  • AUDCHF reversed from support area
  • Further gains are likely

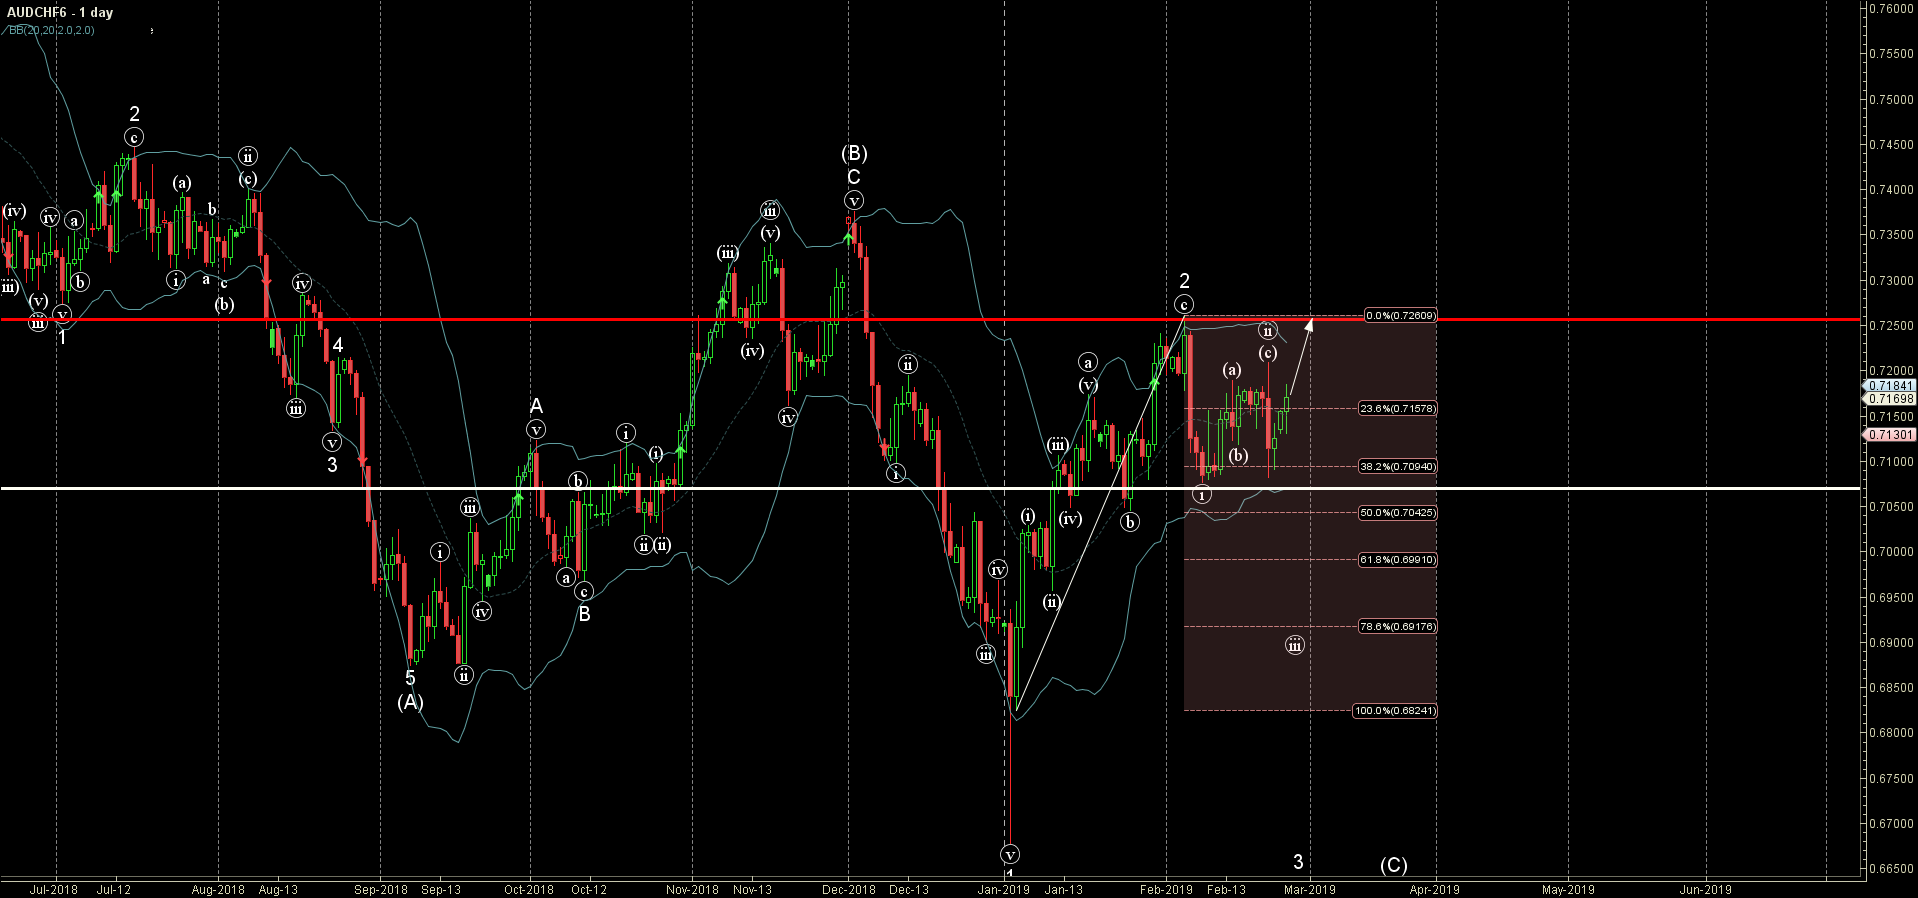
AUDCHF continues to rise after the earlier upward reversal from the support area lying between the key support level 0.7070 (which has been reversing the price from the middle of January) and the lower daily Bollinger Band.

The aforementioned support area was further strengthened by the 38.2% Fibonacci correction of the previous sharp upward impulse from the start of January.

AUDCHF is expected to rise further and re-test the next resistance level 0.7250 (high of the previous wave 2 from the start of February).

AddThis Website Tools
The FxPro Tech Analysis Team

The FxPro technical experts prepare a daily analysis of the most active currency pairs (majors, crosses, exotics) and commodities. Selected instruments are reviewed on daily trends (D1, H4), using the active Elliott Wave setups, Japanese candlesticks, indicators, and support/resistance levels.

Share
Published by
The FxPro Tech Analysis Team
Tags: AUDCHF

Recent Posts

Nikkei 225 Wave Analysis – 23 April 2025

Nikkei 225: ⬆️ Buy - Nikkei 225 broke the resistance area - Likely to rise…

4 hours ago

EURCHF Wave Analysis – 23 April 2025

EURCHF: ⬆️ Buy - EURCHF broke the resistance area - Likely to rise to resistance…

4 hours ago

CADJPY Wave Analysis – 23 April 2025

CADJPY: ⬆️ Buy - CADJPY reversed from strong support area - Likely to rise to…

5 hours ago

USDJPY Wave Analysis – 23 April 2025

USDJPY: ⬆️ Buy - USDJPY reversed from the support area - Likely to rise to…

5 hours ago

Europe’s Growth Stalls Again as the Euro Enters Correction Mode

Eurozone business activity slows as falling orders and declining confidence impact growth. Manufacturing PMI remains…

11 hours ago

The Rapid Assault on Crypto

The cryptocurrency market experienced a significant surge, with market capitalisation reaching $2.95 trillion. Bitcoin is…

14 hours ago