Categories: Technical analysis

AUDCHF Wave Analysis – 2 July, 2019

  • AUDCHF broke resistance area
  • Further gains are likely

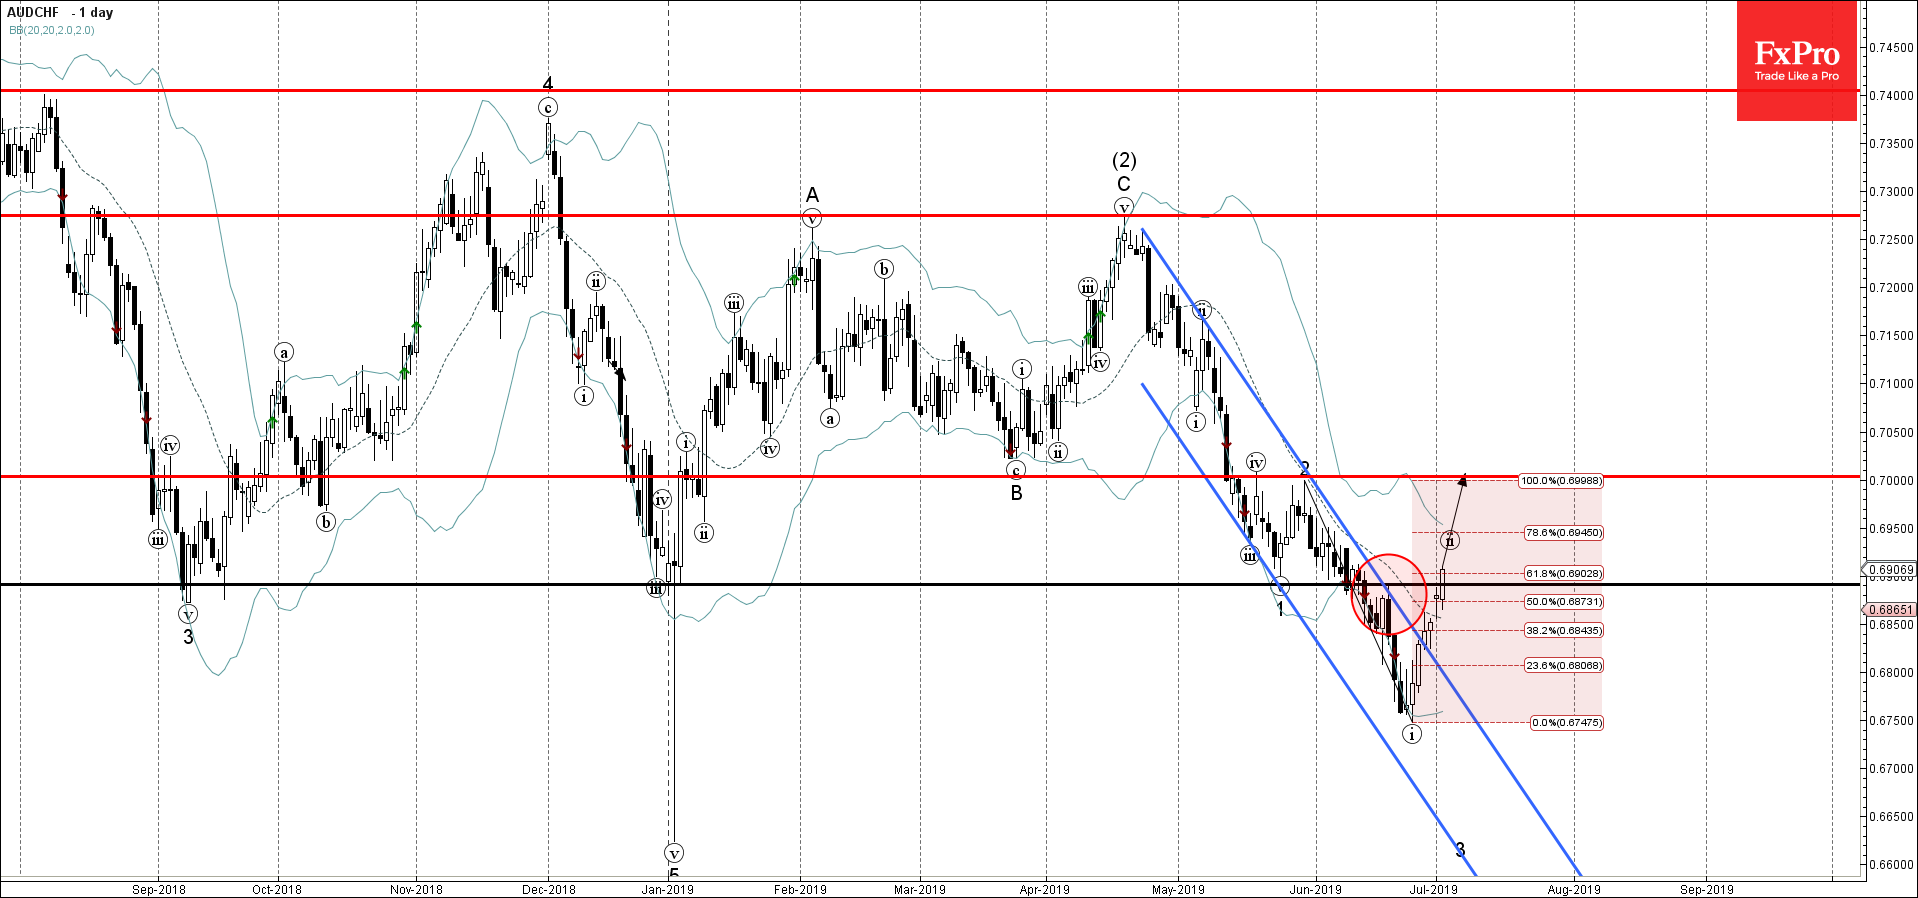
AUDCHF recently broke the resistance area lying between the key resistance level 0.6890 (which reversed the price in the middle of June) and the 50% Fibonacci correction of the previous downward impulse from the end of May.

The breakout of this resistance area accelerated the active short-term correction (ii).

AUDCHF is expected to rise further in the active wave (ii) and retest the next round resistance level 0.7000 (former resistance from May).

The FxPro Tech Analysis Team

The FxPro technical experts prepare a daily analysis of the most active currency pairs (majors, crosses, exotics) and commodities. Selected instruments are reviewed on daily trends (D1, H4), using the active Elliott Wave setups, Japanese candlesticks, indicators, and support/resistance levels.

Share
Published by
The FxPro Tech Analysis Team
Tags: AUDCHF

Recent Posts

How Low Can the USDJPY Go? 

USDJPY was slipping below 153 on Friday morning, a three-week low and having lost over…

1 hour ago

Bitcoin’s Downtrend, Solana and Ethereum Form Double Bottom

Market picture  Crypto market capitalisation rose 3.3% in 24 hours to $2.22 trillion. Local capitalisation…

7 hours ago

EURJPY Wave Analysis 2 May 2024

- EURJPY under strong bearish pressure - Likely to fall to support level 163.10 EURJPY…

20 hours ago

WTI crude oil Wave Analysis 2 May 2024

- WTI broke round support level 80.00 - Likely to fall to support level 76.00…

20 hours ago

ADP hints at another strong NFP on Friday

The monthly ADP labour market report showed that America created 192K new jobs in April, above…

2 days ago

Fed’s hawkish tone risks sinking S&P500 to 4700

Bears showed strength ahead of the FOMC decision.  U.S. indices sagged on Tuesday as investors…

2 days ago

This website uses cookies