Categories: Technical analysis

AUDCHF Wave Analysis 18 December, 2020

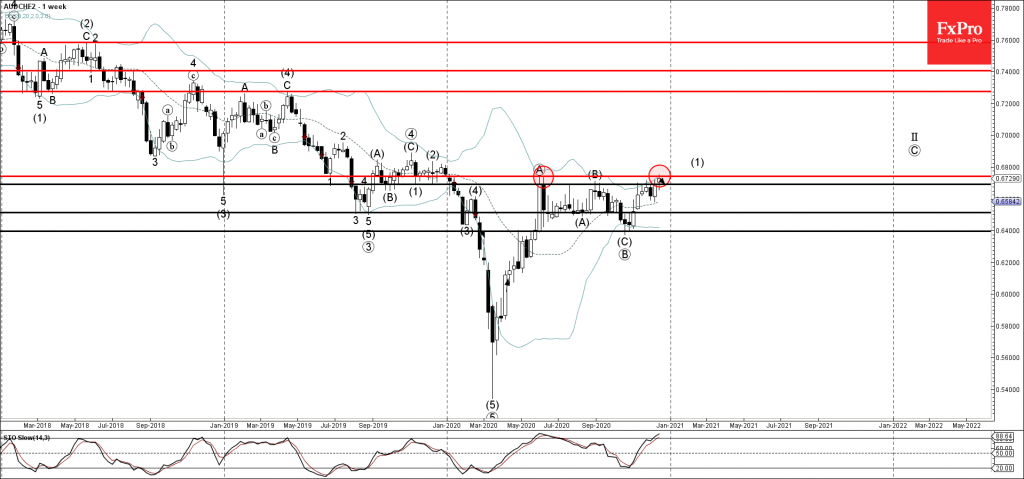
• AUDCHF reversed from long-term resistance level 0.6740

• Likely to fall to 0.6700

AUDCHF recently reversed down from the strong long-term resistance level 0.6740 (former multi-month resistance from May).

The resistance area near the resistance level 0.6740 was further strengthened by the upper weekly Bollinger Band.

Given the overbought weekly Stochastic and the moderately bullish CHF sentiment – AUDCHF is expected to fall further toward the next support level 0.6700.

The FxPro Tech Analysis Team

The FxPro technical experts prepare a daily analysis of the most active currency pairs (majors, crosses, exotics) and commodities. Selected instruments are reviewed on daily trends (D1, H4), using the active Elliott Wave setups, Japanese candlesticks, indicators, and support/resistance levels.

Share
Published by
The FxPro Tech Analysis Team
Tags: AUDCHF

Recent Posts

A slightly weaker CPI was not enough to break through the highs

US CPI data a bit softer than forecasts, sparking brief market optimism, but resistance remains.…

5 hours ago

Pro News Flash: Global Tensions Fuel a Fresh Oil Rally

🛢️ Oil prices are finding fresh strength as geopolitical tensions in the Middle East reignite…

5 hours ago

Crude Oil counteracts

Middle East tensions and Venezuelan supply shifts drive Brent crude volatility, with geopolitical risks and…

8 hours ago

Crypto market grows with risk appetite in stocks

Crypto market edges up as risk appetite returns; Bitcoin and Ethereum recover, despite investor caution…

9 hours ago

The yen returned to the Takaichi trade

The dollar resumed its growth after the lawsuit against the Fed chairman. Rumours of early…

10 hours ago

Nat Gas Current situation #tradelikeapro #trading #natgas #tradingstrategy #tradingshorts

Today is Tuesday, the 13th of January, and we will talk about the natural gas…

12 hours ago

This website uses cookies