Categories: Technical analysis

AUDCHF Wave Analysis – 17 December , 2018

  • AUDCHF reversed from resistance area
  • Further losses are likely

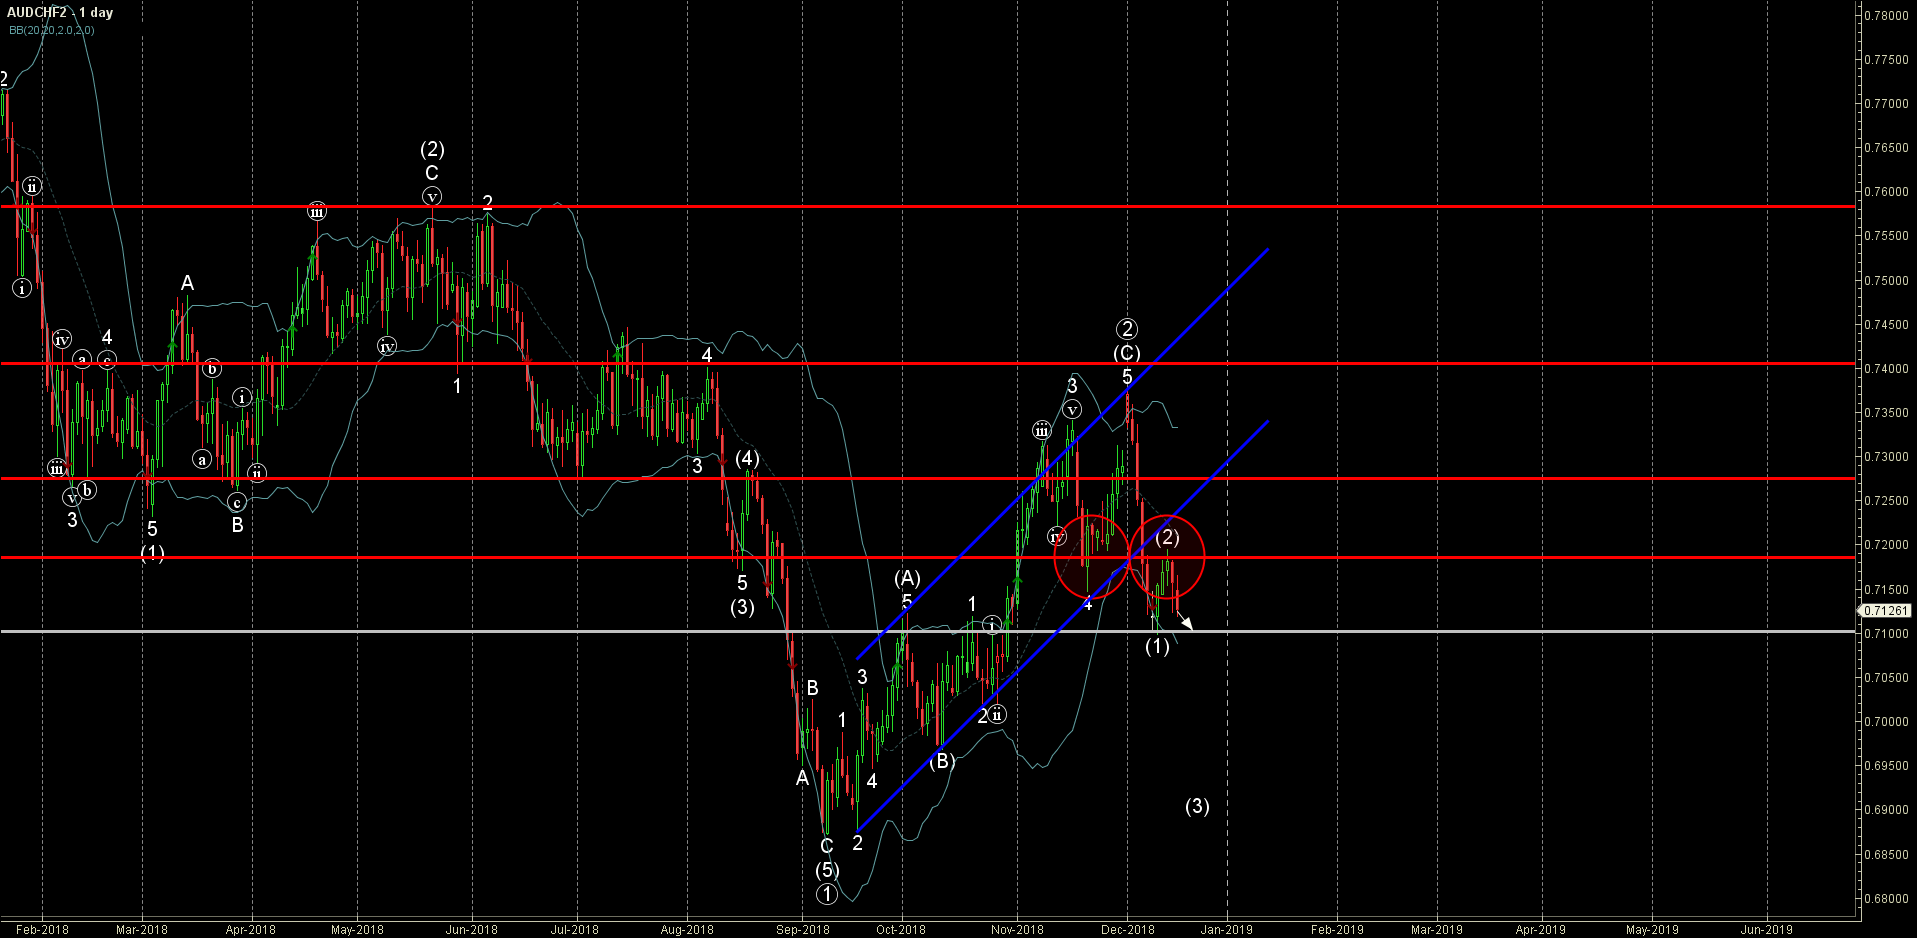
AUDCHF recently reversed down from the resistance area lying between the key resistance level 0.7180 (former support from the middle of November) and lower trendline of the recently broken daily up channel from September (acting as resistance after it was broken).

The downward reversal from this resistance area created the daily Japanese candlesticks reversal pattern Evening Star.

AUDCHF is expected to fall further in the active medium-term impulse wave (3) and re-test the next support level 0.7100 (low of the impulse (1)).

The FxPro Tech Analysis Team

The FxPro technical experts prepare a daily analysis of the most active currency pairs (majors, crosses, exotics) and commodities. Selected instruments are reviewed on daily trends (D1, H4), using the active Elliott Wave setups, Japanese candlesticks, indicators, and support/resistance levels.

Share
Published by
The FxPro Tech Analysis Team
Tags: AUDCHF

Recent Posts

USDJPY Wave Analysis 26 April 2024

- USDJPY broke key resistance level 155.00 - Likely to rise to resistance level 160.00…

2 days ago

Ebay Wave Analysis 26 April 2024

- Ebay reversed from support level 49.35 - Likely to rise to resistance level 52.55…

2 days ago

False Alert with Yen Interventions?

Even though the Bank of Japan left the key rate and parameters of the QE…

3 days ago

Cooler Bitcoin

Market picture  Market Dynamics: The cryptocurrency market stabilised, losing just 0.1% of capitalisation and dropping to…

3 days ago

GBPCAD Wave Analysis 25 April 2024

- GBPCAD reversed from key support level 1.6910 - Likely to rise to resistance level…

4 days ago

GBPAUD Wave Analysis 25 April 2024

- GBPAUD reversed from support level 1.9135 - Likely to rise to resistance level 1.9360…

4 days ago

This website uses cookies