Categories: Technical analysis

AUDCHF Wave Analysis 16 October, 2020

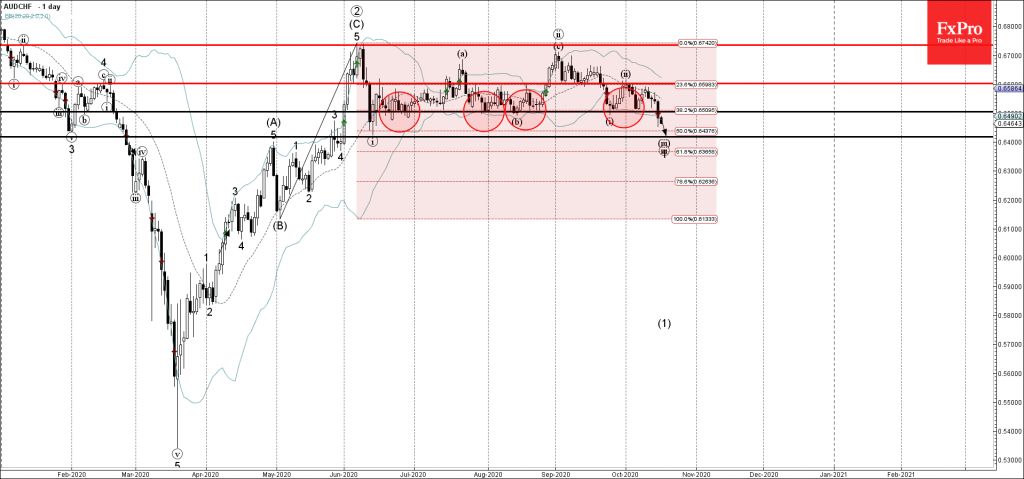
• AUDCHF broke key support level 0.6500

• Likely to reach 0.6400

AUDCHF recently broke below the key support level 0.6500 (which has been reversing the price from the end of June) intersecting with the 38.2% Fibonacci correction of the upward impulse (C) from May.

The breakout of the support level 0.6500 accelerated the active impulse waves (iii) and 1 – inside which the pair has been moving from September and June respectively.

AUDCHF is likely to fall further toward the next support level 0.6400 (former low of wave (i) from the start of June).

The FxPro Tech Analysis Team

The FxPro technical experts prepare a daily analysis of the most active currency pairs (majors, crosses, exotics) and commodities. Selected instruments are reviewed on daily trends (D1, H4), using the active Elliott Wave setups, Japanese candlesticks, indicators, and support/resistance levels.

Share
Published by
The FxPro Tech Analysis Team
Tags: AUDCHF

Recent Posts

Pro News Flash: Bitcoin Is Stuck While Billion Dollar Buyers Step In

🛟 Bitcoin is having a hard time staying afloat, even as major players step in…

3 hours ago

Natural Gas. Current situation #trandingshorts #tradelikeapro #trading #tradingstrategy #naturalgas

We're gonna talk about the gas market, where prices are falling rapidly. Let's take a…

5 hours ago

The dollar remains focused on the labour market

The US dollar weakened significantly in 2025, and its fate depends on central banks. The…

5 hours ago

Major coins dragged the market down

Major cryptocurrencies fell amid declining market sentiment, low liquidity, and institutional rebalancing, with Bitcoin dropping…

7 hours ago

Dogecoin Wave Analysis – 15 December 2025

Dogecoin: ⬇️ Sell - Dogecoin broke long-term support level 0.1365 - Likely to fall to…

20 hours ago

Alcoa Wave Analysis – 15 December 2025

Alcoa: ⬇️ Sell - Alcoa reversed from strong resistance level 47.00 - Likely to fall to…

20 hours ago

This website uses cookies