Categories: Technical analysis

AUDCHF Wave Analysis – 07 April, 2020

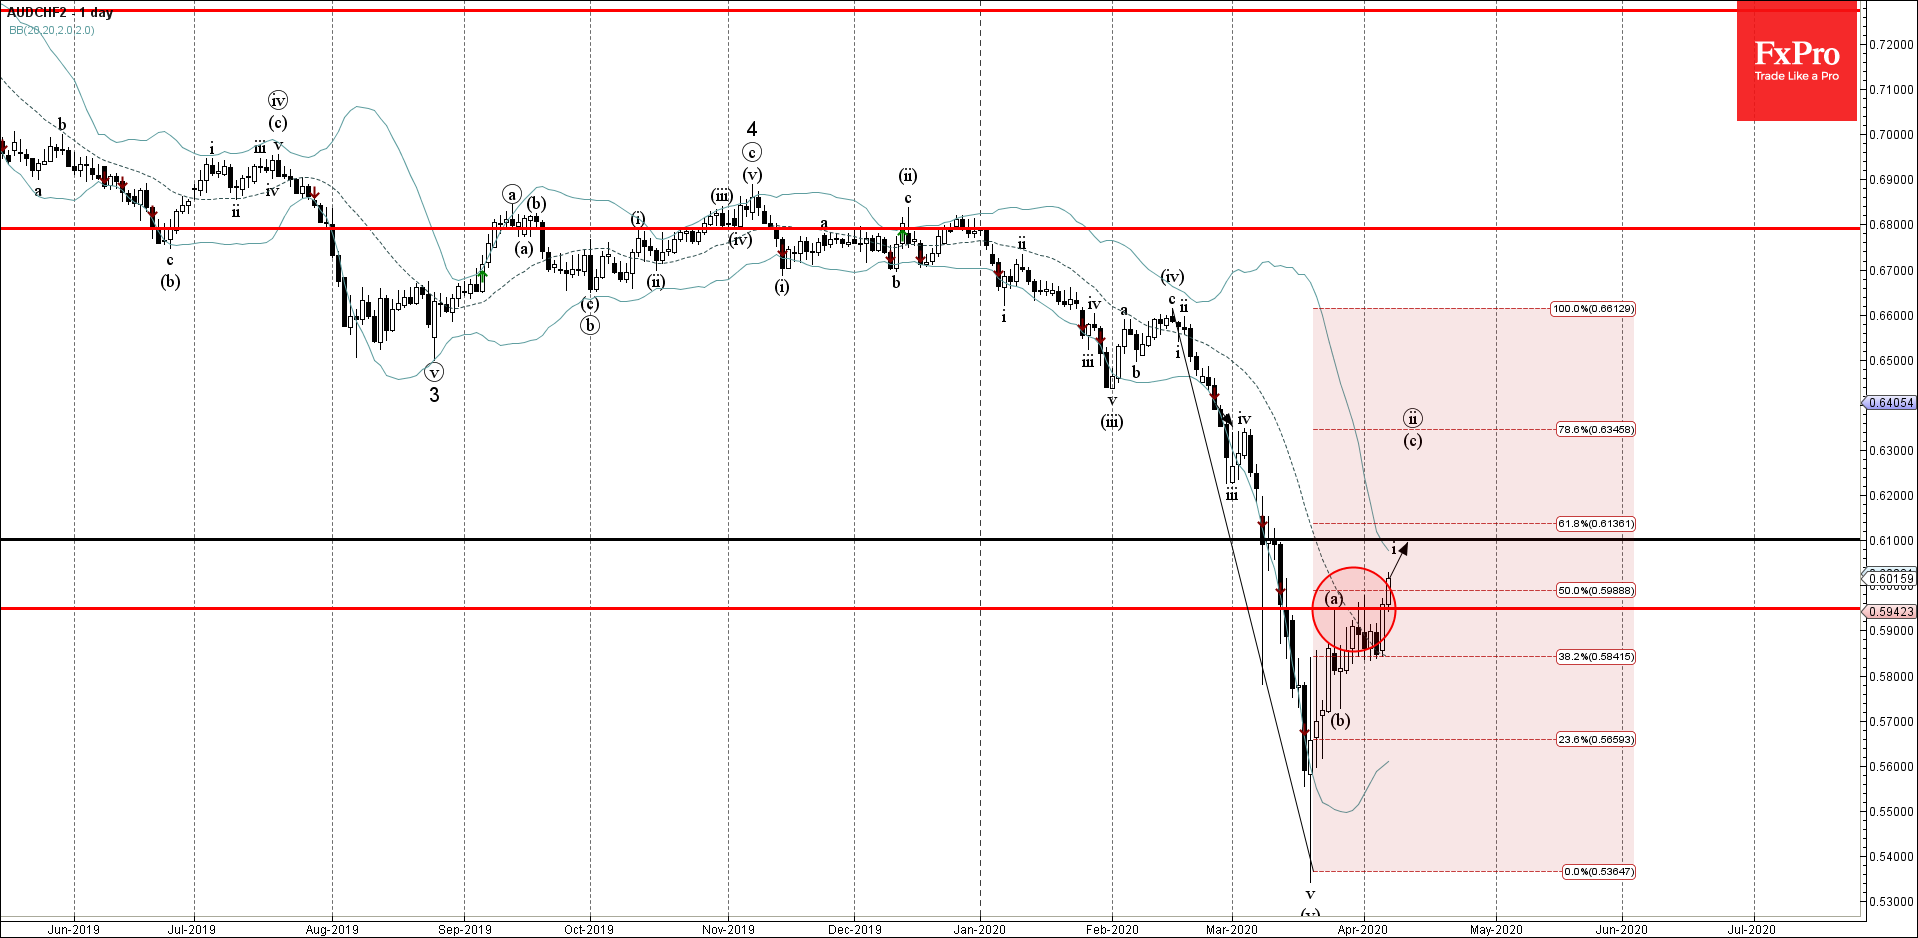
  • AUDCHF broke resistance area
  • Likely to rise to 0.6150

AUDCHF recently broke the resistance area located between the key resistance level 0.5950 (which has been reversing the price from the middle of March) and the 50% Fibonacci retracement of the pervious sharp downward impulse from February.

The breakout of this resistance area should accelerate the active impulse wave (c).

AUDCHF is likely to rise further toward the next round resistance level 0.6150 (standing close to the 61.8% Fibonacci retracement of the downward impulse from February).

The FxPro Tech Analysis Team

The FxPro technical experts prepare a daily analysis of the most active currency pairs (majors, crosses, exotics) and commodities. Selected instruments are reviewed on daily trends (D1, H4), using the active Elliott Wave setups, Japanese candlesticks, indicators, and support/resistance levels.

Share
Published by
The FxPro Tech Analysis Team
Tags: AUDCHF2

Recent Posts

Crude Oil counteracts

Middle East tensions and Venezuelan supply shifts drive Brent crude volatility, with geopolitical risks and…

1 hour ago

Crypto market grows with risk appetite in stocks

Crypto market edges up as risk appetite returns; Bitcoin and Ethereum recover, despite investor caution…

2 hours ago

The yen returned to the Takaichi trade

The dollar resumed its growth after the lawsuit against the Fed chairman. Rumours of early…

4 hours ago

Nat Gas Current situation #tradelikeapro #trading #natgas #tradingstrategy #tradingshorts

Today is Tuesday, the 13th of January, and we will talk about the natural gas…

5 hours ago

Bitcoin Cash Wave Analysis – 12 January 2026

Bitcoin Cash: ⬇️ Sell - Bitcoin Cash reversed from resistance area - Likely to fall…

15 hours ago

EURJPY Wave Analysis – 12 January 2026

EURJPY: ⬆️ Buy - EURJPY reversed from support area - Likely to rise to resistance…

15 hours ago

This website uses cookies