Categories: Technical analysis

AUDCAD Wave Analysis – 29 April, 2020

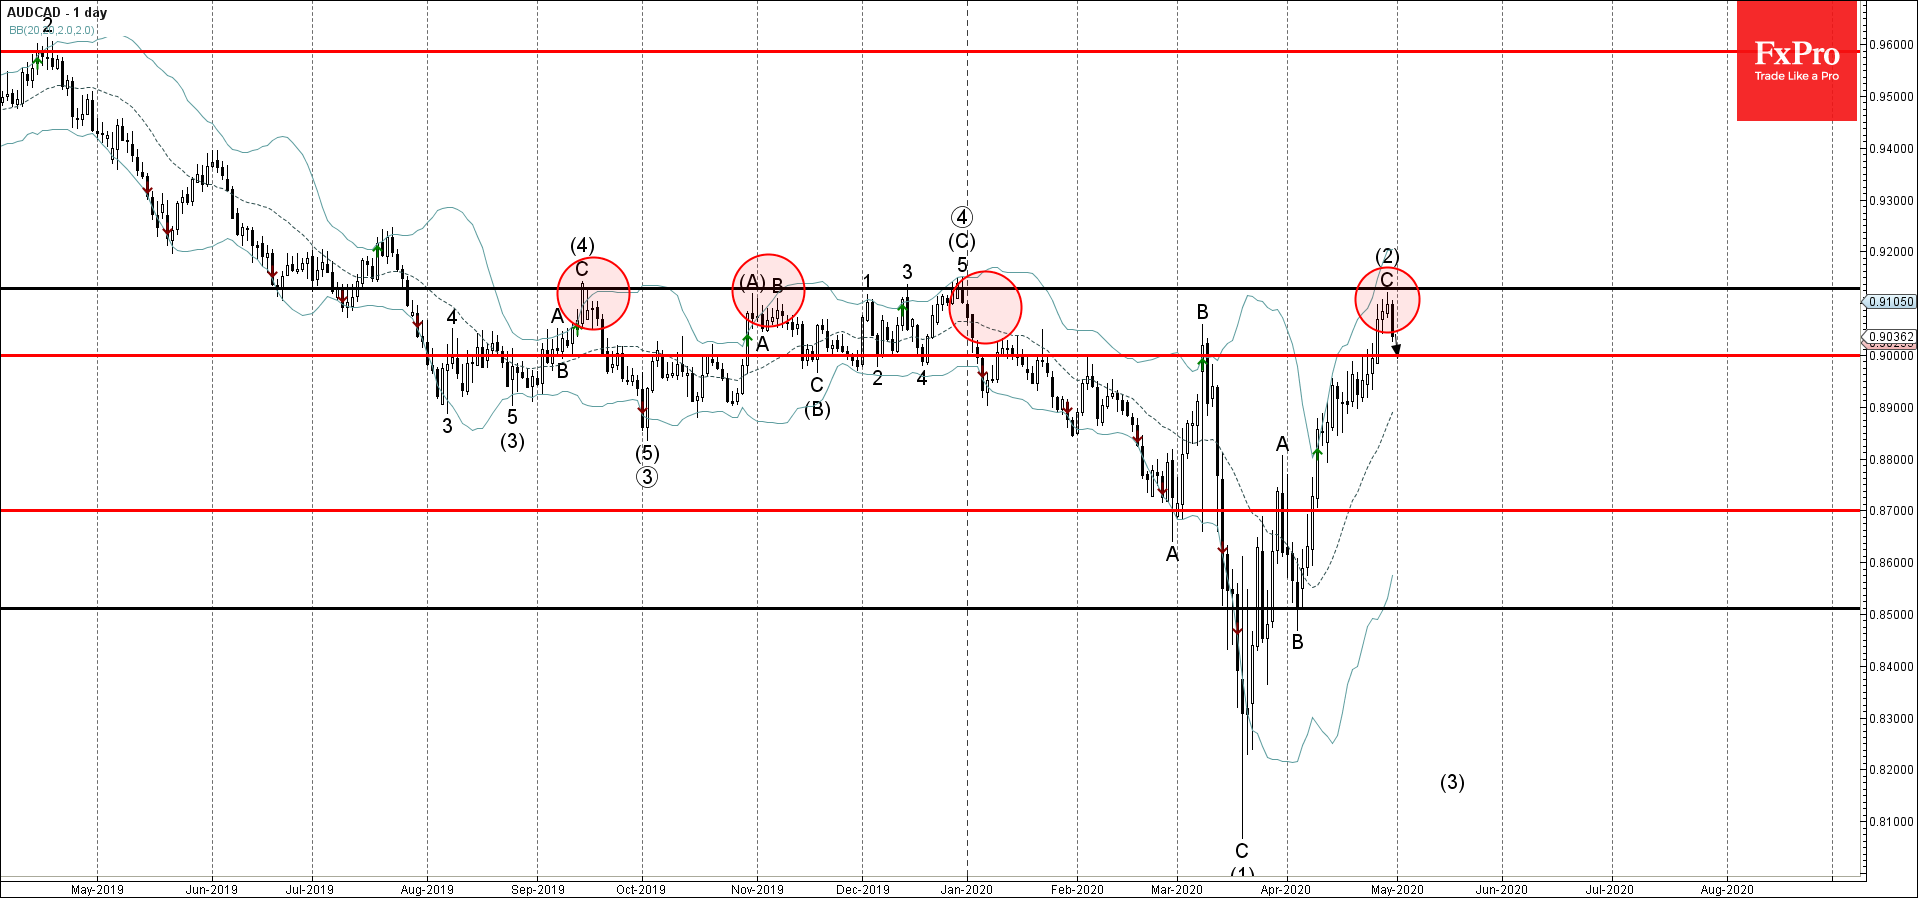
  • AUDCAD reversed from resistance area
  • Likely to fall to 0.9000

AUDCAD recently reversed down from the resistance area lying between the resistance level 0.9130 (which has been reversing the price from September) and the upper daily Bollinger Band.

The downward reversal from this resistance area stopped the earlier medium-term ABC correction (2) from the middle of March.

AUDCAD is expected to fall further toward the next support level 0.9000 (former resistance level from January and February).

AddThis Website Tools
The FxPro Tech Analysis Team

The FxPro technical experts prepare a daily analysis of the most active currency pairs (majors, crosses, exotics) and commodities. Selected instruments are reviewed on daily trends (D1, H4), using the active Elliott Wave setups, Japanese candlesticks, indicators, and support/resistance levels.

Share
Published by
The FxPro Tech Analysis Team
Tags: AUDCAD

Recent Posts

Bitcoin pushes up from 200-day MA

Bitcoin pushed back from its 200-day low, with the crypto market capitalization rising to $2.86…

38 minutes ago

Video: Market Shake-Up! Dollar, Bitcoin & Gold on the Move – What’s Next?

Big moves are brewing in the markets! 📉📈 The US Dollar is forming a bottom,…

6 hours ago

Tesla Wave Analysis – 21 March 2025

Tesla: ⬆️ Buy - Tesla reversed from support level 220.00 - Likely to rise to…

3 days ago

Google Wave Analysis – 21 March 2025

Google: ⬆️ Buy - Google reversed from key support level 160.00 - Likely to rise…

3 days ago

Silver Wave Analysis – 21 March 2025

Silver: ⬇️ Sell - Silver reversed from resistance level 34.00 - Likely to fall to…

3 days ago

USDCHF Wave Analysis – 21 March 2025

USDCHF: ⬆️ Buy - USDCHF reversed from support level 0,8750 - Likely to fall to…

3 days ago