Categories: Technical analysis

AUDCAD Wave Analysis 25 September 2023

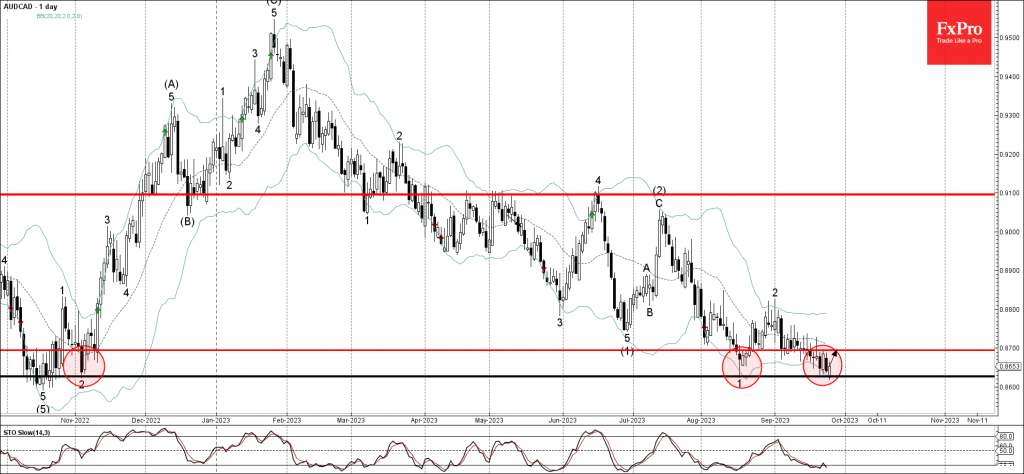
– AUDCAD reversed from key support level 0.8630

– Likely to rise to resistance level 0.8700

AUDCAD recently reversed up from the key support level 0.8630 (which has been repeatedly reversing the pair from last November) intersecting with the lower daily Bollinger Band.

The upward reversal from the support level 0.8630 follows the earlier upward reversal from the same support level – which formed the daily Bullish Engulfing.

Given the oversold daily Stochastic and the strength of the support level 0.8630, AUDCAD can be expected to rise toward the next resistance level 0.8700.

AddThis Website Tools
The FxPro Tech Analysis Team

The FxPro technical experts prepare a daily analysis of the most active currency pairs (majors, crosses, exotics) and commodities. Selected instruments are reviewed on daily trends (D1, H4), using the active Elliott Wave setups, Japanese candlesticks, indicators, and support/resistance levels.

Share
Published by
The FxPro Tech Analysis Team
Tags: AUDCAD

Recent Posts

S&P 500 Wave Analysis – 1 April 2025

S&P 500: ⬆️ Buy - S&P 500 reversed from support area - Likely to rise…

5 hours ago

GBPAUD Wave Analysis – 1 April 2025

GBPAUD: ⬇️ Sell - GBPAUD reversed from long-term resistance level 2.0820 - Likely to fall…

5 hours ago

Crypto’s Attempt to Stabilise

The cryptocurrency market has experienced some volatility, with a 1.1% rise in 24 hours and…

17 hours ago

NIO Wave Analysis – 31 March 2025

NIO: ⬆️ Buy - NIO reversed from support zone - Likely to rise to resistance…

1 day ago

Nvidia Wave Analysis – 31 March 2025

Nvidia: ⬆️ Buy - Nvidia reversed from key support level 105.00 - Likely to rise…

1 day ago

Markets rattled on consumer sentiment

Consumer sentiment index from the University of Michigan shows alarming information for stock indices, with…

1 day ago