Categories: Technical analysis

AUDCAD Wave Analysis – 25 March, 2020

  • AUDCAD reversed from resistance area
  • Likely to fall to 0.8500

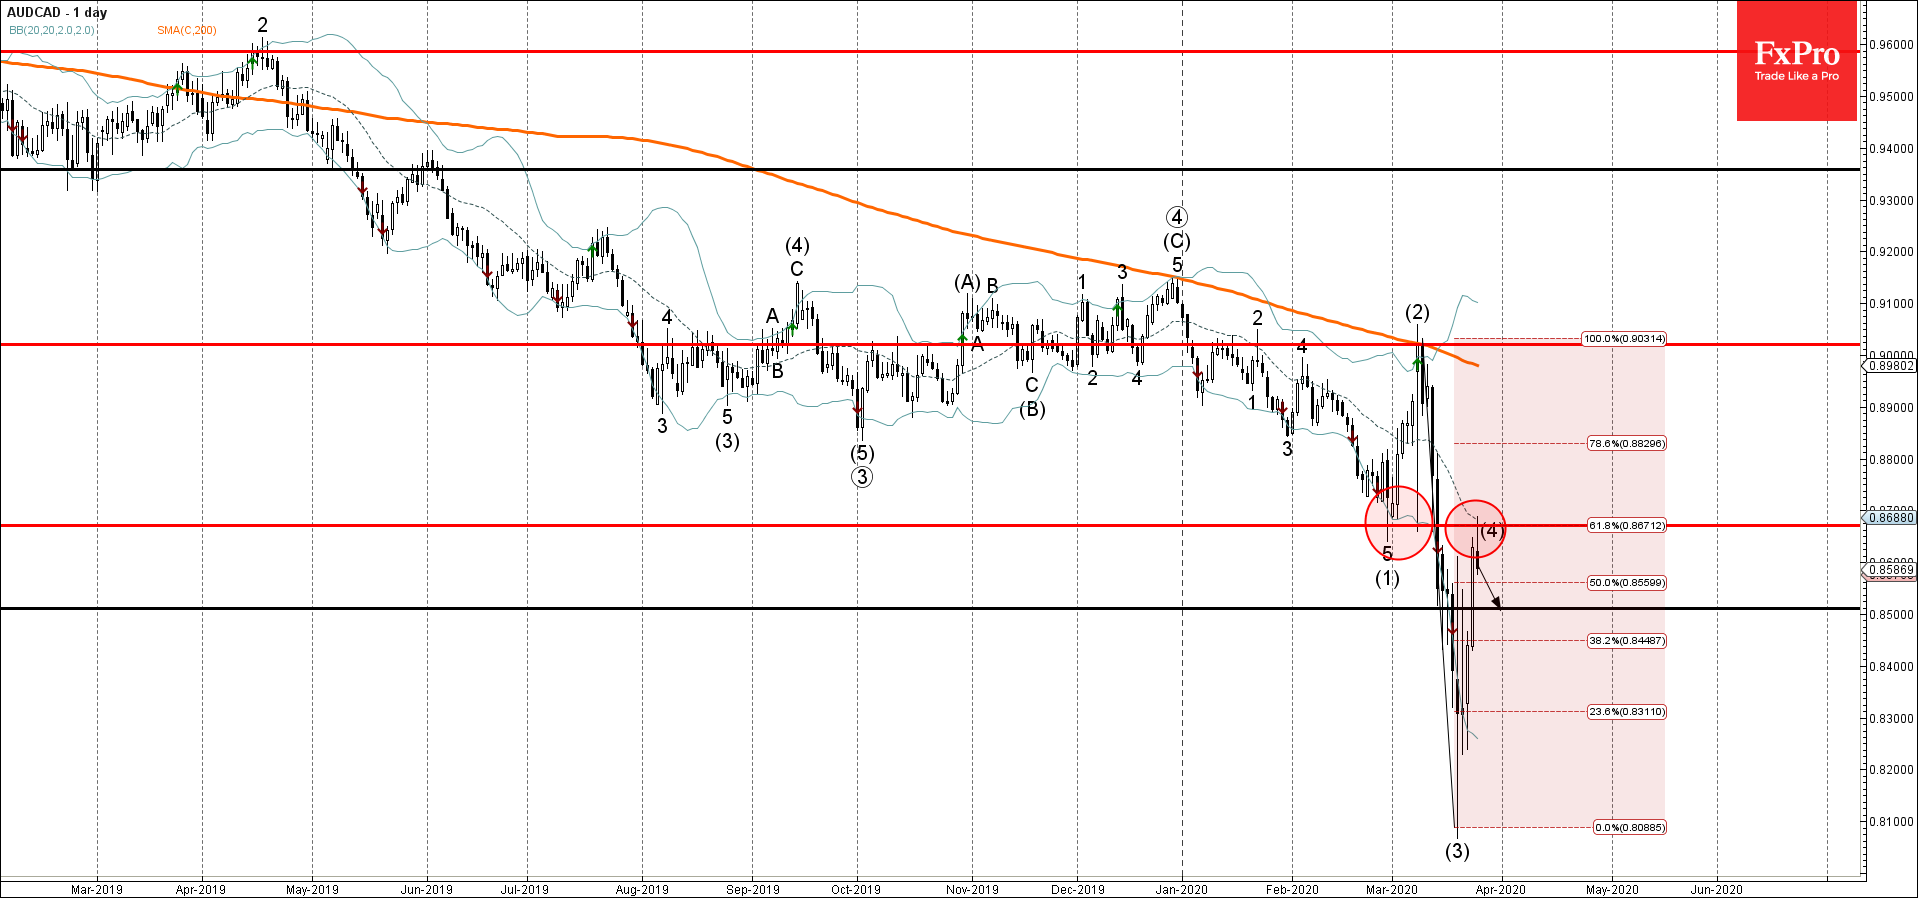
AUDCAD recently reversed down from the resistance area lying between the resistance level 0.8670 (former strong support from February) and the 61.8% Fibonacci correction of the previous sharp downward impulse (3).

The downward reversal from this resistance area stopped the previous medium-term ABC correction (4).

Given the strength of the downtrend that can be seen on the daily charts – AUDCAD is likely fall further toward the next support level 0.8500.

The FxPro Tech Analysis Team

The FxPro technical experts prepare a daily analysis of the most active currency pairs (majors, crosses, exotics) and commodities. Selected instruments are reviewed on daily trends (D1, H4), using the active Elliott Wave setups, Japanese candlesticks, indicators, and support/resistance levels.

Share
Published by
The FxPro Tech Analysis Team
Tags: AUDCAD

Recent Posts

The dollar does not tolerate dissent

US GDP growth is driven not by the White House, but by AI. The Bank…

10 hours ago

The crypto market has made a breakthrough

The crypto market surges, hitting new highs, with bullish sentiment for Bitcoin and Ethereum amid…

10 hours ago

Brent Crude oil Wave Analysis – 13 January 2026

Brent Crude oil ⬆️ Buy - Brent Crude oil rising inside impulse wave c -…

24 hours ago

USDJPY Wave Analysis – 13 January 2026

USDJPY ⬆️ Buy - USDJPY broke resistance area - Likely to rise to resistance level…

24 hours ago

Exxon Mobil Wave Analysis – 13 January 2026

Exxon Mobil ⬆️ Buy - Exxon Mobil broke resistance level 125.60 - Likely to rise…

24 hours ago

BNB Wave Analysis – 13 January 2026

Brent Crude oil ⬆️ Buy - BNB broke out of sideways price range - Likely…

24 hours ago

This website uses cookies