Categories: Technical analysis

AUDCAD Wave Analysis – 20 February, 2020

  • AUDCAD broke key support level 0.8840
  • Likely to fall to 0.8750

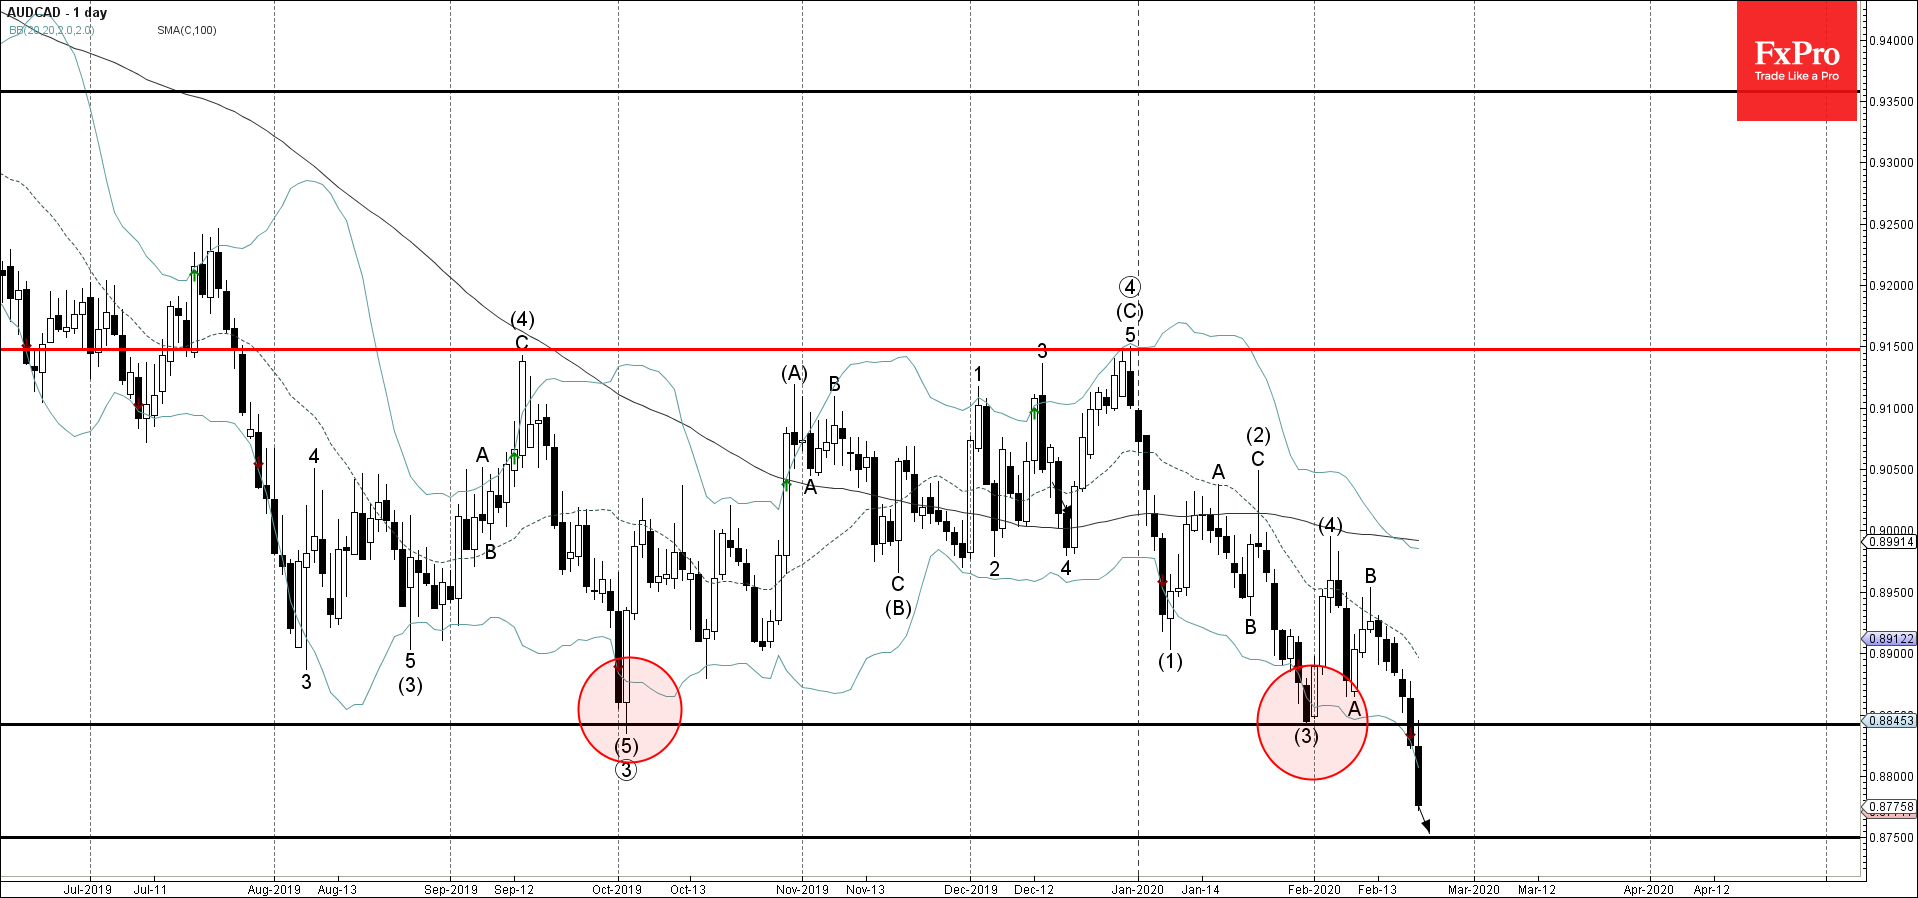
AUDCAD continues to fall sharply after the earlier breakout of the key support level 0.8840 (which has been reversing the price from the start of October, as can be seen from the daily AUDCAD chart below).

The breakout of the support level 0.8840 should accelerate the active medium-term impulse sequence (5) from the start of February.

Given the clear daily downtrend – AUDCAD is likely to fall further toward the next support level 0.8750. Strong resistance now stands at 0.8840.


The FxPro Tech Analysis Team

The FxPro technical experts prepare a daily analysis of the most active currency pairs (majors, crosses, exotics) and commodities. Selected instruments are reviewed on daily trends (D1, H4), using the active Elliott Wave setups, Japanese candlesticks, indicators, and support/resistance levels.

Share
Published by
The FxPro Tech Analysis Team
Tags: AUDCAD

Recent Posts

Bitcoin’s Downtrend, Solana and Ethereum Form Double Bottom

Market picture  Crypto market capitalisation rose 3.3% in 24 hours to $2.22 trillion. Local capitalisation…

4 hours ago

EURJPY Wave Analysis 2 May 2024

- EURJPY under strong bearish pressure - Likely to fall to support level 163.10 EURJPY…

17 hours ago

WTI crude oil Wave Analysis 2 May 2024

- WTI broke round support level 80.00 - Likely to fall to support level 76.00…

17 hours ago

ADP hints at another strong NFP on Friday

The monthly ADP labour market report showed that America created 192K new jobs in April, above…

2 days ago

Fed’s hawkish tone risks sinking S&P500 to 4700

Bears showed strength ahead of the FOMC decision.  U.S. indices sagged on Tuesday as investors…

2 days ago

A new stage of Bitcoin’s decline

Market Picture  Bitcoin's closing price on Tuesday became the lowest since late February, confirming the…

2 days ago

This website uses cookies