Categories: Technical analysis

AUDCAD Wave Analysis 13 October, 2020

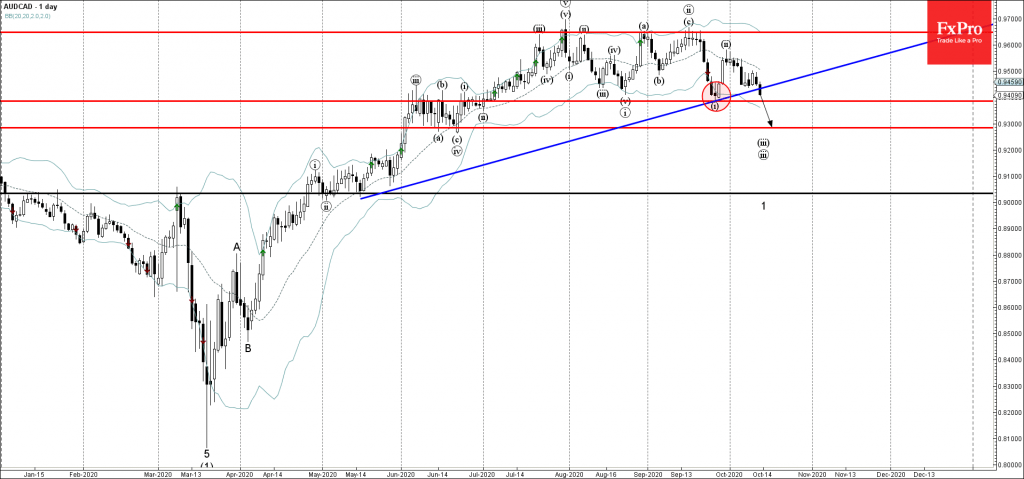
• AUDCAD broke support trendline

• Likely to fall to 0.9385 and 0.9300

AUDCAD continues to fall after the earlier breakout of the multi-month support trendline from the middle of May.

The breakout of this support trendline should accelerate the active short-term impulse waves (iii) and 1.

AUDCAD is likely to fall further toward the next support level 0.9385 (low of the daily Morning Star from September) – the breakout of which will lead to further losses toward 0.9300 (former strong support from June).

The FxPro Tech Analysis Team

The FxPro technical experts prepare a daily analysis of the most active currency pairs (majors, crosses, exotics) and commodities. Selected instruments are reviewed on daily trends (D1, H4), using the active Elliott Wave setups, Japanese candlesticks, indicators, and support/resistance levels.

Share
Published by
The FxPro Tech Analysis Team
Tags: AUDCAD

Recent Posts

AUDJPY Wave Analysis – 5 December 2025

AUDJPY: ⬆️ Buy - AUDJPY broke long-term resistance level 102.30 - Likely to rise to…

1 day ago

Aptos Wave Analysis – 5 December 2025

Aptos: ⬇️ Sell - Aptos testing major support at 1.688 - Likely to fall to…

1 day ago

Pro News Weekly: Market Shake-Up, Dollar Drops, Gold Surges, Bitcoin Wobbles!

Welcome to Pro News Flash! 💵 The U.S. dollar slips 🏆 Major stock indices struggle…

1 day ago

Solana Wave Analysis – 5 December 2025

Solana: ⬇️ Sell - Solana reversed from resistance zone - Likely to fall to support…

1 day ago

EURAUD Wave Analysis – 5 December 2025

EURAUD : ⬇️ Sell - EURAUD broke the support level 1.7600 - Likely to fall…

1 day ago

Forex has set its priorities

In 2026, experts favour the yen, see modest euro growth, and expect pressure on the…

2 days ago

This website uses cookies