Categories: Technical analysis

AUDCAD Wave Analysis 12 September 2024

– AUDCAD reversed from support zone

– Likely to rise to the resistance level 0.9150

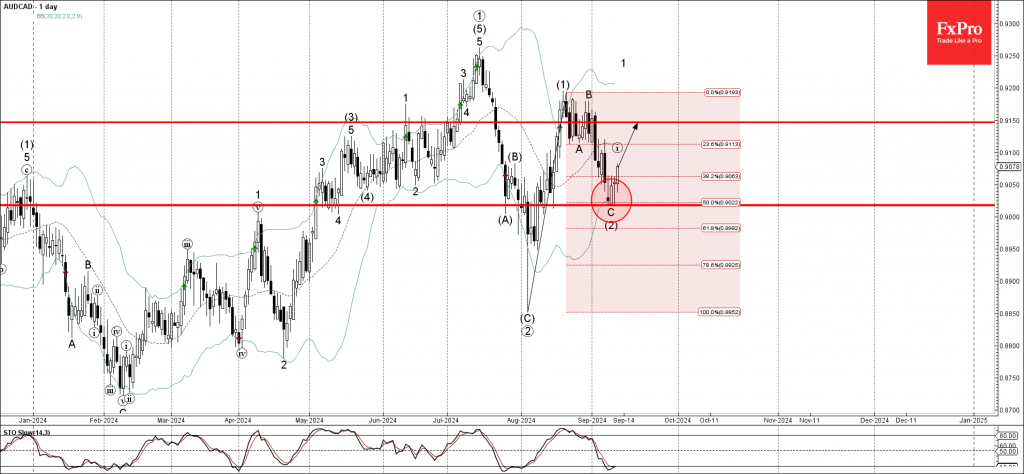
AUDCAD recently reversed up from the support area between the support level 0.9020 (which reversed the price at the start of August) and the lower daily Bollinger Band.

The upward reversal from the support level 0.9020 stopped the C-wave of the previous ABC correction (2).

Given the clear daily uptrend, AUDCAD can be expected to rise further to the next resistance level 0.9150 (middle of the congestions zone, which stopped the earlier waves (1) and B).

The FxPro Tech Analysis Team

The FxPro technical experts prepare a daily analysis of the most active currency pairs (majors, crosses, exotics) and commodities. Selected instruments are reviewed on daily trends (D1, H4), using the active Elliott Wave setups, Japanese candlesticks, indicators, and support/resistance levels.

Share
Published by
The FxPro Tech Analysis Team
Tags: AUDCAD

Recent Posts

Crypto market climbs out of the pit

The crypto market as a whole and Bitcoin hit three-week highs, but are still in…

6 hours ago

AUDCAD Wave Analysis 18 September 2024

- AUDCAD broke pivotal resistance level 0.9170 - Likely to rise to resistance level 0.9260…

19 hours ago

WTI Wave Analysis 18 September 2024

- WTI reversed from round resistance level 70.00 - Likely to fall to support level…

19 hours ago

Strong data didn’t derail markets from expectations of a 50bp Fed cut

US retail sales rose 0.1% m/m in August, better than forecast, but sales growth in…

1 day ago

The crypto market gets a boost from stocks

Market Picture The crypto market has gained 2.1% in the last 24 hours to reach…

1 day ago

MasterCard Wave Analysis 17 September 2024

- MasterCard broke round resistance level 500.00 - Likely to rise to the resistance level…

2 days ago

This website uses cookies