Categories: Technical analysis

AUDCAD Wave Analysis – 06 November , 2018

• AUDCAD reversed from support area • Further gains are likely

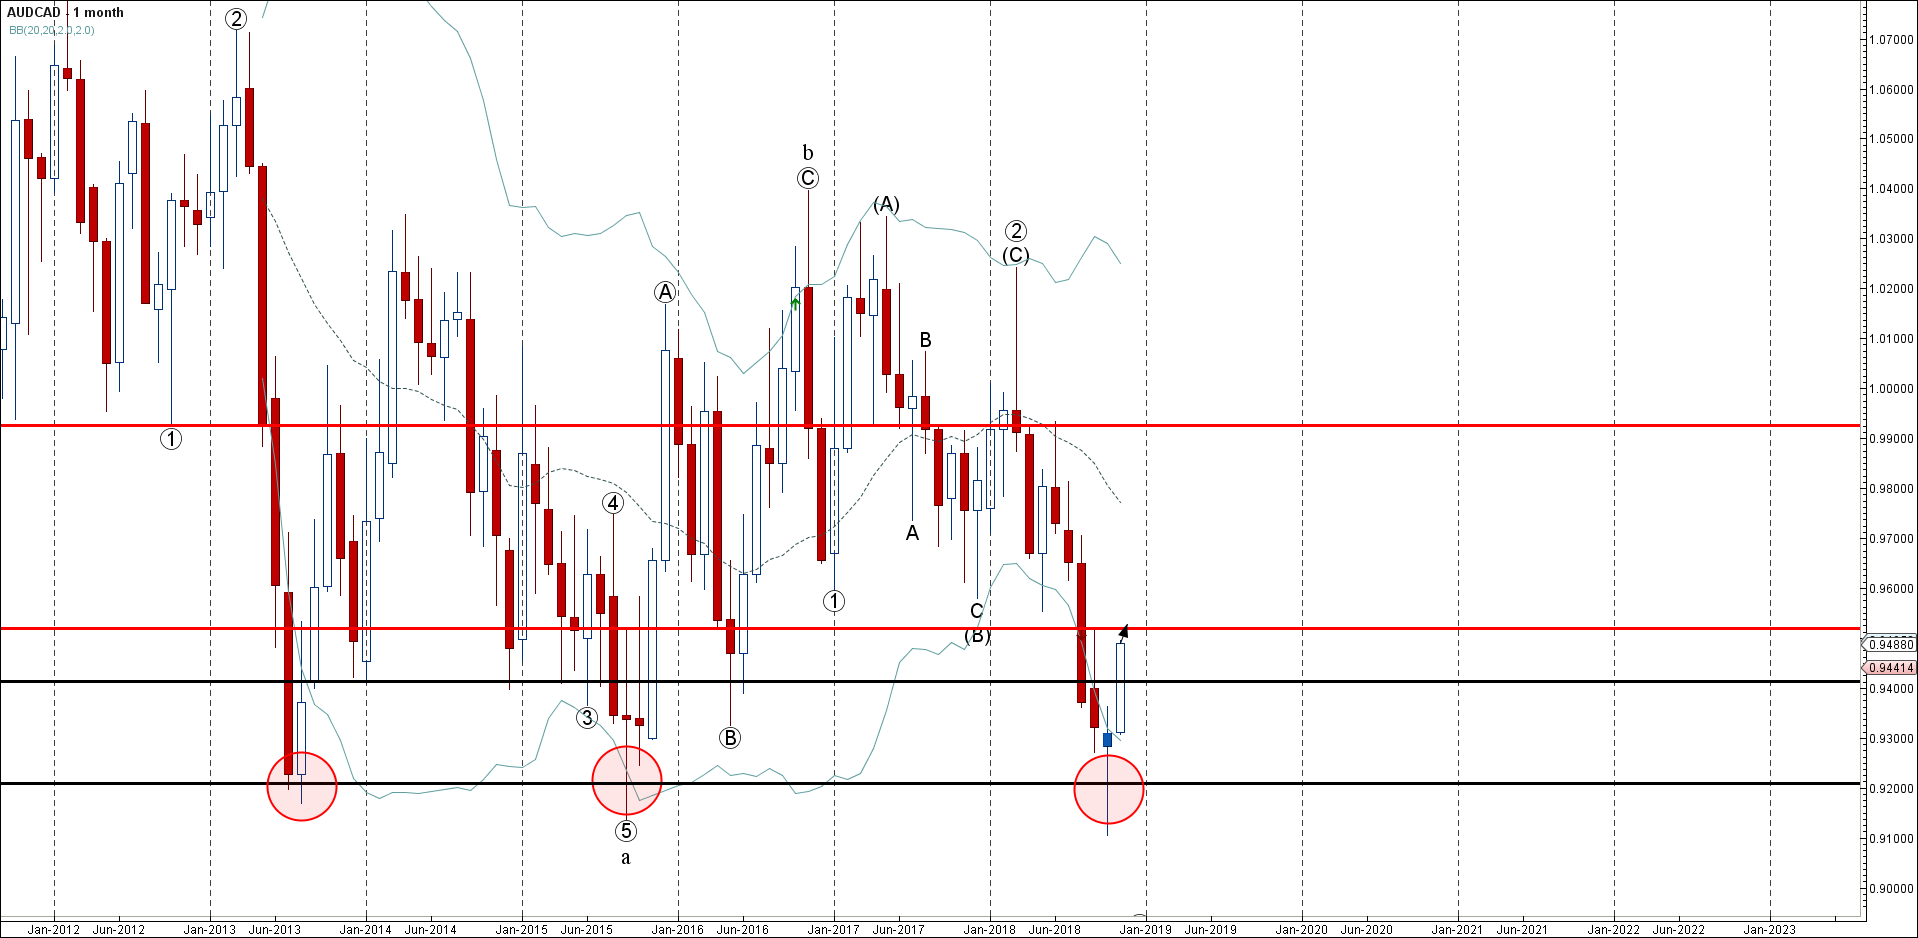
AUDCAD continues to rise inside the weekly upward impulse wave – which started previously – when the price reversed up sharply from the major support area lying between the multi- support level 0.9200 and the lower monthly Bollinger Band.

The upward reversal from this support area created the strong monthly Japanese candlesticks reversal pattern Hammer (highlighted below).

AUDCAD is like to rise further and re-test the next resistance level 0.9520 (previous monthly high from September).

The FxPro Tech Analysis Team

The FxPro technical experts prepare a daily analysis of the most active currency pairs (majors, crosses, exotics) and commodities. Selected instruments are reviewed on daily trends (D1, H4), using the active Elliott Wave setups, Japanese candlesticks, indicators, and support/resistance levels.

Share
Published by
The FxPro Tech Analysis Team
Tags: AUDCAD

Recent Posts

EURCHF Wave Analysis – 14 May, 2024

• EURCHF rising inside impulse wave 3 • Likely to reach resistance level 0.9835 EURCHF…

16 hours ago

Goldman Sachs Wave Analysis – 14 May, 2024

• Goldman Sachs broke the key resistance level 430.00 • Likely to rise to resistance…

16 hours ago

⚡️Calling all EV Stock Sharks⚡️

Zeekr, China's Tesla rival, recently had its IPO, and now you can trade it at…

18 hours ago

Oil is retreating but unlikely to repeat the collapses of 2020, 2014 or 2008

Crude oil has been under pressure over the past four weeks but has been gaining…

19 hours ago

Ethereum knocking at support’s door

Market picture Crypto market capitalisation rose 0.8% over the past 24 hours to 2.2 trillion,…

1 day ago

Platinum Wave Analysis – 13 May, 2024

• Platinum reversed from resistance level 1010.00 • Likely to fall to support level 990.00…

1 day ago

This website uses cookies