Categories: Technical analysis

AUDCAD Analysis 05 November, 2020

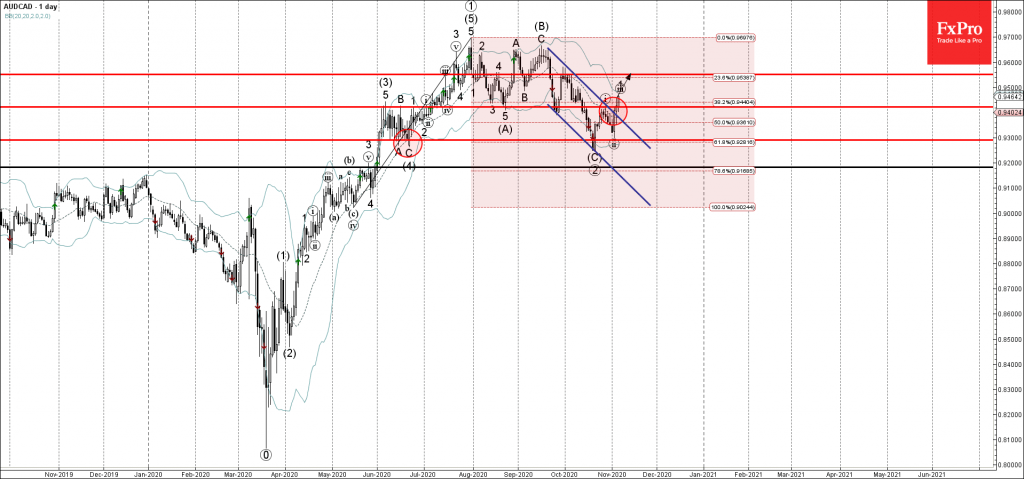
• AUDCAD broke key resistance level 0.9420

• Likely to rise to 0.9550                                                                                          

AUDCAD recently broke sharply above the key resistance level 0.9420 (top of the previous impulse wave (i)), intersecting with the resistance trendline of the daily don channel from the middle of September.

The breakout of the resistance level 0.9420 accelerated the active short-term impulse waves (iii) and 1.

AUDCAD is likely to rise further toward the next resistance level 0.9550 (which reversed the price at the start of October).

AddThis Website Tools
The FxPro Tech Analysis Team

The FxPro technical experts prepare a daily analysis of the most active currency pairs (majors, crosses, exotics) and commodities. Selected instruments are reviewed on daily trends (D1, H4), using the active Elliott Wave setups, Japanese candlesticks, indicators, and support/resistance levels.

Share
Published by
The FxPro Tech Analysis Team
Tags: AUDCAD

Recent Posts

NZDUSD Wave Analysis – 19 March 2025

NZDUSD: ⬇️ Sell - NZDUSD reversed from the resistance level 0.5820 - Likely to fall…

7 hours ago

EURUSD Wave Analysis – 19 March 2025

EURUSD: ⬇️ Sell - EURUSD reversed from resistance level 1.0930 - Likely to fall to…

7 hours ago

Ethereum gives way

The crypto market remains in a downtrend, with Ethereum losing market share while Bitcoin's share…

12 hours ago

GBPUSD Wave Analysis – 18 March 2025

GBPUSD: ⬆️ Buy - GBPUSD reversed from support zone - Likely to rise to resistance…

1 day ago

GBPAUD Wave Analysis – 18 March 2025

GBPAUD: ⬆️ Buy - GBPAUD reversed from the support zone - Likely to rise to…

1 day ago

Solana Wave Analysis – 18 March 2025

Solana: ⬇️ Sell - Solana reversed from the resistance zone - Likely to fall to…

1 day ago