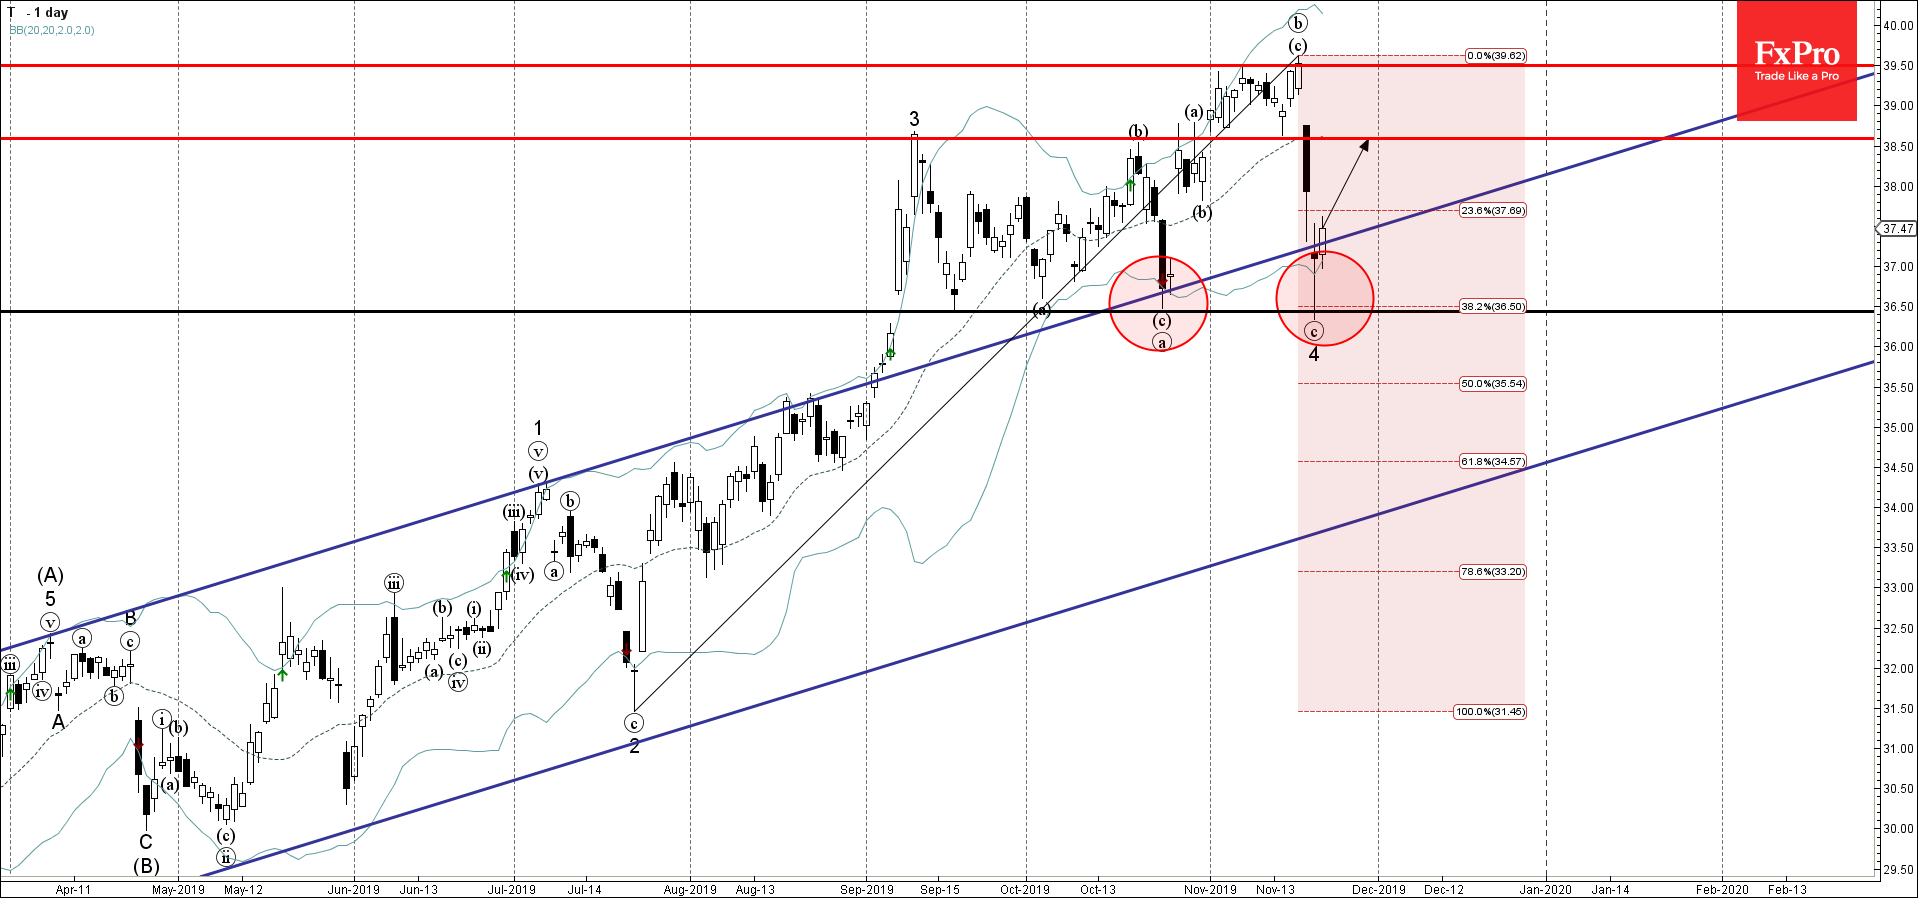
- AT&T reversed from support area
- Likely to rise to 38,50
AT&T recently reversed up from the support area lying between the support level 36,50 (monthly low from October), lower daily Bollinger Band and the 38,2% Fibonacci correction of the previous upward impulse from July.
The upward reversal from this support area started the active short-term impulse wave 5.
AT&T is expected to rise further toward the next resistance level 38,50 (former strong resistance from September and October).