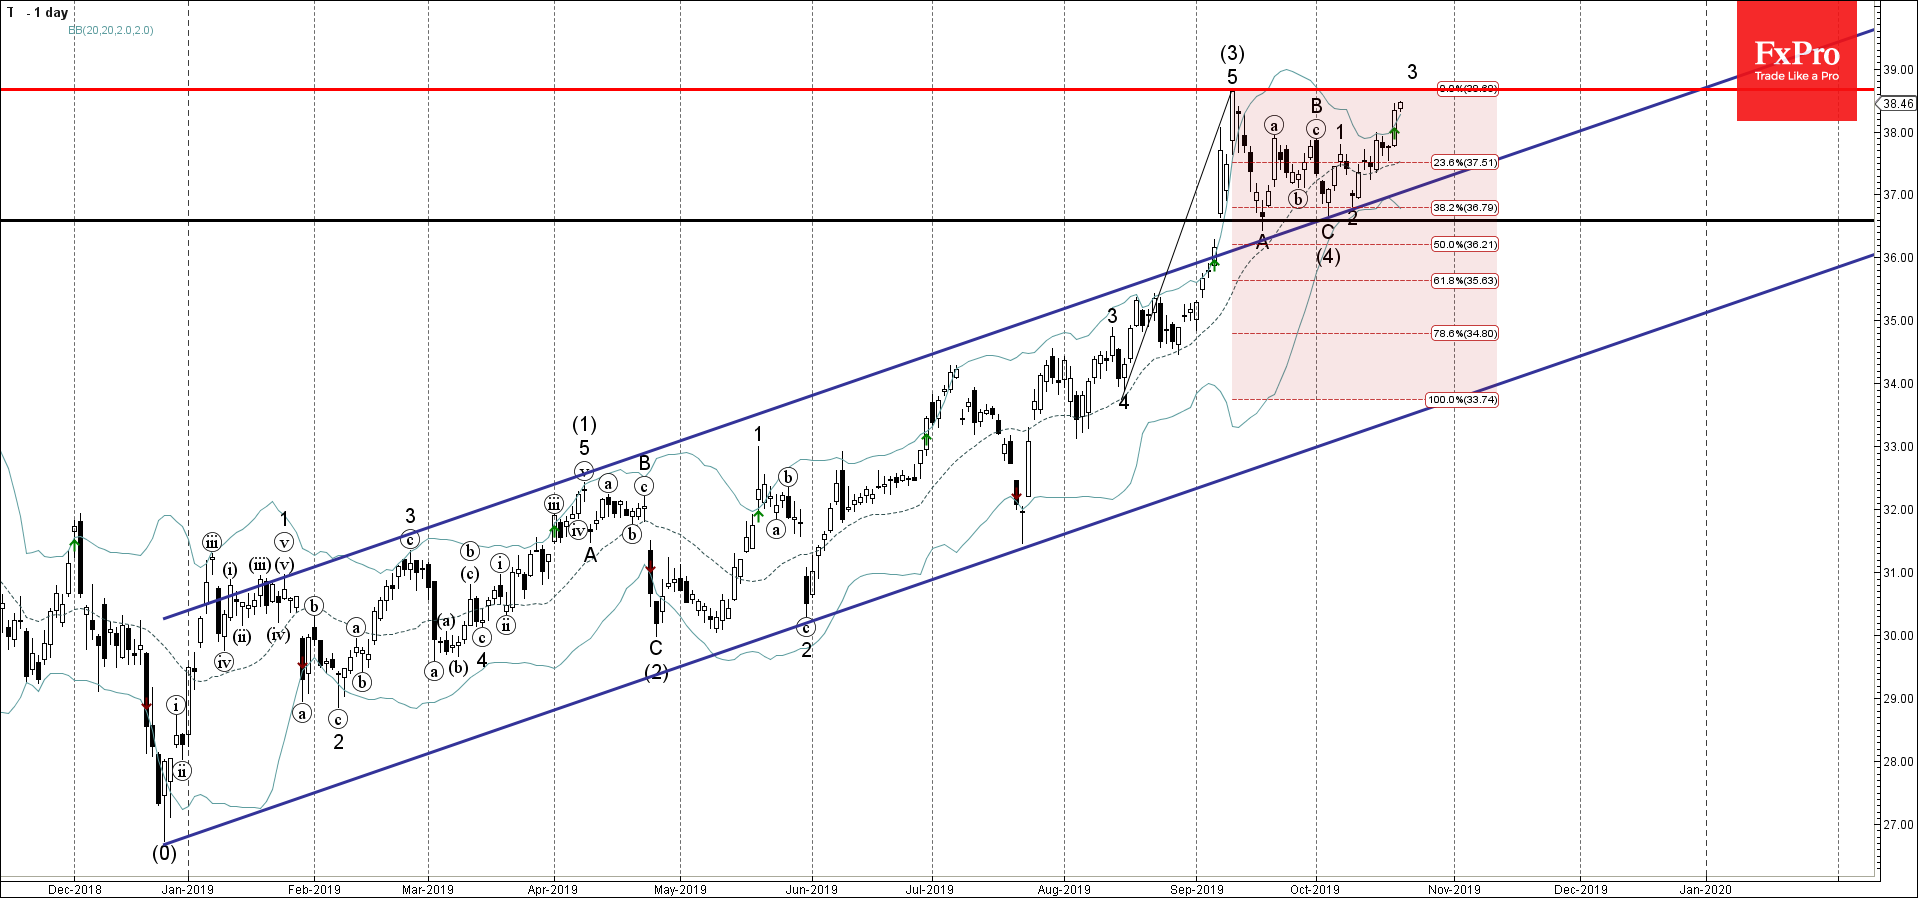
- AT&T rising inside impulse wave 3
- Likely to rise to 38.70
AT&T continues to rise inside the short-term impulse wave 3 – which started earlier from the support zone lying between the support level 36.60 and the lower daily Bollinger Band.
This support zone was further strengthened by the upper trendline of the recently broke daily up channel from last December.
AT&T is expected to rise further and retest the next resistance level 38.70 (top of wave (3) and the target price calculated for the completion of the active impulse wave 3).