Categories: Technical analysis

AT&T Wave Analysis – 08 April, 2020

  • AT&T reversed from resistance area
  • Likely to fall to 28.00

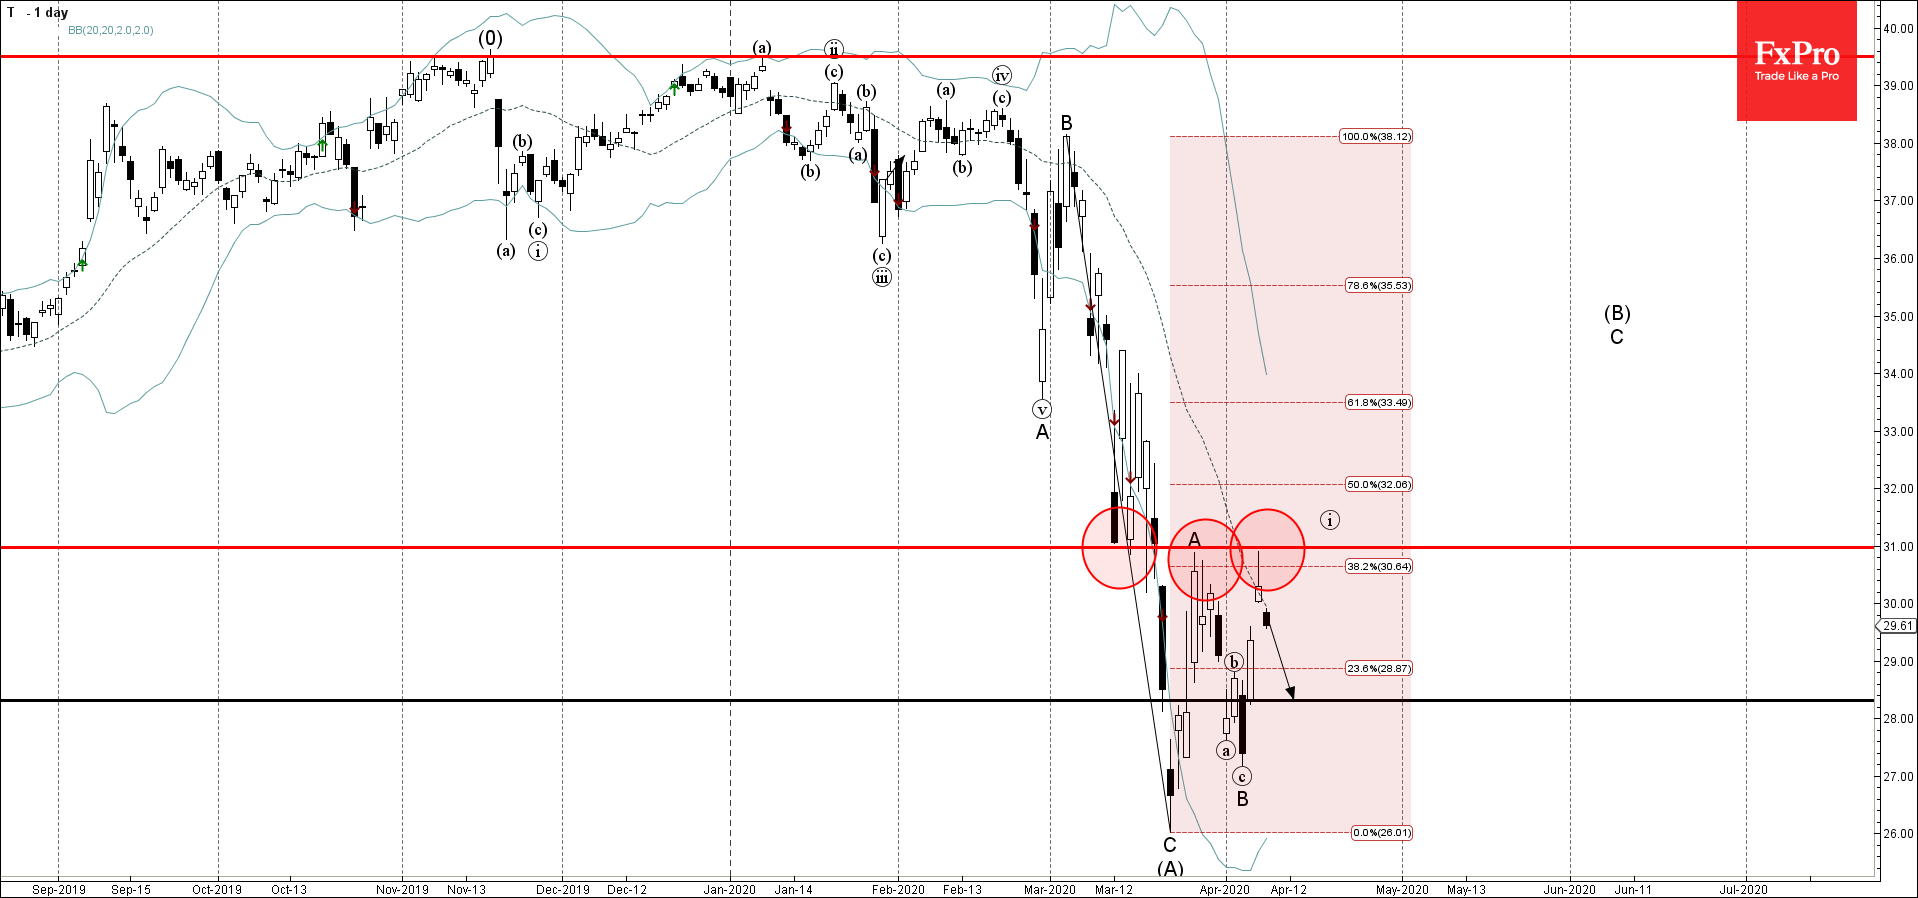
AT&T recently reversed down from the combined resistance zone located between the key resistance level 31.00 (former strong support from March) and the 38,2% Fibonacci correction of the previous sharp downward impulse C from last month.

The downward reversal from this resistance zone stopped the earlier impulse wave C from the start of April – which belongs to wave (B) from March.

Given the strength of the aforementioned resistance zone – AT&T is likely to fall further toward the next support level 28.00.

The FxPro Tech Analysis Team

The FxPro technical experts prepare a daily analysis of the most active currency pairs (majors, crosses, exotics) and commodities. Selected instruments are reviewed on daily trends (D1, H4), using the active Elliott Wave setups, Japanese candlesticks, indicators, and support/resistance levels.

Share
Published by
The FxPro Tech Analysis Team
Tags: T

Recent Posts

ANF Wave Analysis 29 April 2024

ANF reversed from key support level 113.40 Likely to rise to resistance level 132.31 ANF…

15 mins ago

GBPUSD Wave Analysis 29 April 2024

- GBPUSD rising inside minor correction 2 - Likely to rise to resistance level 1.2700…

17 mins ago

Crypto Market Retreats Due to Overhang of Sellers

Market picture The crypto market has lost 3.3% in the last 24 hours to $2.3…

10 hours ago

USDJPY Wave Analysis 26 April 2024

- USDJPY broke key resistance level 155.00 - Likely to rise to resistance level 160.00…

3 days ago

Ebay Wave Analysis 26 April 2024

- Ebay reversed from support level 49.35 - Likely to rise to resistance level 52.55…

3 days ago

False Alert with Yen Interventions?

Even though the Bank of Japan left the key rate and parameters of the QE…

3 days ago

This website uses cookies