Technical analysis

Apple Wave Analysis – 23 December 2025

Apple: ⬆️ Buy

– Apple reversed from support area

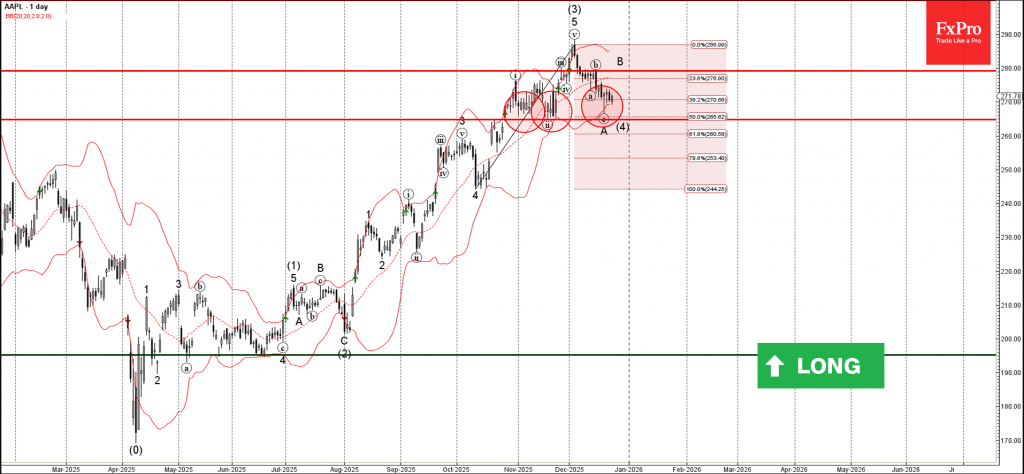
– Likely to rise to resistance level 280.00

Apple recently reversed with the daily Hammer from the support area between the strong support level 264.75 (former strong resistance from October and the monthly low from November) and the lower daily Bollinger Band.

The support level 264.75 was strengthened by the 50% Fibonacci correction of the sharp upward impulse from October.

Given the clear daily uptrend, Apple can be expected to rise to the next resistance level 280.00 (top of the previous wave b).

The FxPro Tech Analysis Team

The FxPro technical experts prepare a daily analysis of the most active currency pairs (majors, crosses, exotics) and commodities. Selected instruments are reviewed on daily trends (D1, H4), using the active Elliott Wave setups, Japanese candlesticks, indicators, and support/resistance levels.

Share
Published by
The FxPro Tech Analysis Team
Tags: apple

Recent Posts

Bitcoin Wave Analysis – 14 January 2026

Bitcoin: ⬆️ Buy - Bitcoin broke resistance area - Likely to rise to resistance level…

14 hours ago

NZDJPY Wave Analysis – 14 January 2026

NZDJPY: ⬇️ Sell - NZDJPY reversed down from the resistance area - Likely to fall…

14 hours ago

What is Leverage?

Leverage is a mechanism that lets traders control larger positions using smaller capital. By choosing…

19 hours ago

The dollar does not tolerate dissent

US GDP growth is driven not by the White House, but by AI. The Bank…

1 day ago

The crypto market has made a breakthrough

The crypto market surges, hitting new highs, with bullish sentiment for Bitcoin and Ethereum amid…

1 day ago

Brent Crude oil Wave Analysis – 13 January 2026

Brent Crude oil ⬆️ Buy - Brent Crude oil rising inside impulse wave c -…

2 days ago

This website uses cookies