Categories: Technical analysis

Apple Wave Analysis 14 June 2024

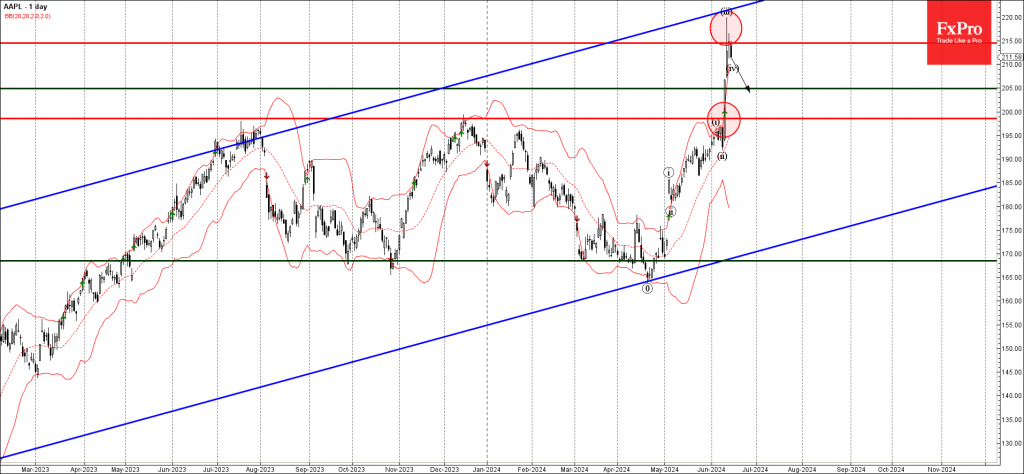
– Apple reversed from resistance zone

– Likely to fall to support level 205.00

Apple recently reversed down from the resistance zone located between the resistance level 215.00 and the resistance trendline of the wide weekly up channel from last year.

The downward reversal from the resistance level 215.00 created the daily Japanese candlesticks reversal pattern Long-legged Doji.

Given the strength of the resistance level 215.00, Apple can be expected to fall further to the next support level 205.00, target for the completion of the active wave iv.

The FxPro Tech Analysis Team

The FxPro technical experts prepare a daily analysis of the most active currency pairs (majors, crosses, exotics) and commodities. Selected instruments are reviewed on daily trends (D1, H4), using the active Elliott Wave setups, Japanese candlesticks, indicators, and support/resistance levels.

Share
Published by
The FxPro Tech Analysis Team
Tags: apple

Recent Posts

GBPCHF Wave Analysis 25 June 2024

- GBPCHF reversed from support level 1.1220 - Likely to rise to resistance level 1.1450…

9 hours ago

USDCAD Wave Analysis 25 June 2024

- USDCAD reversed from key support level 1.3620 - Likely to rise to resistance level…

9 hours ago

Nasdaq100 and Nvidia: shakeout, but no reversal yet

Shares of Nvidia, the world's most traded, most popular, and most valuable company, have been…

17 hours ago

Bitcoin’s Attractive Drop

Market Picture The cryptocurrency market was falling to a total capitalisation of $2.2 trillion at…

20 hours ago

Amazon Wave Analysis 24 June 2024

- Amazon reversed from key resistance level 188.50 - Likely to fall to support level…

1 day ago

EURJPY Wave Analysis 24 June 2024

- EURJPY approaching strong resistance level 171.55 - Likely to correct down from 171.55 EURJPY…

1 day ago

This website uses cookies