Categories: Technical analysis

ANF Wave Analysis 29 April 2024

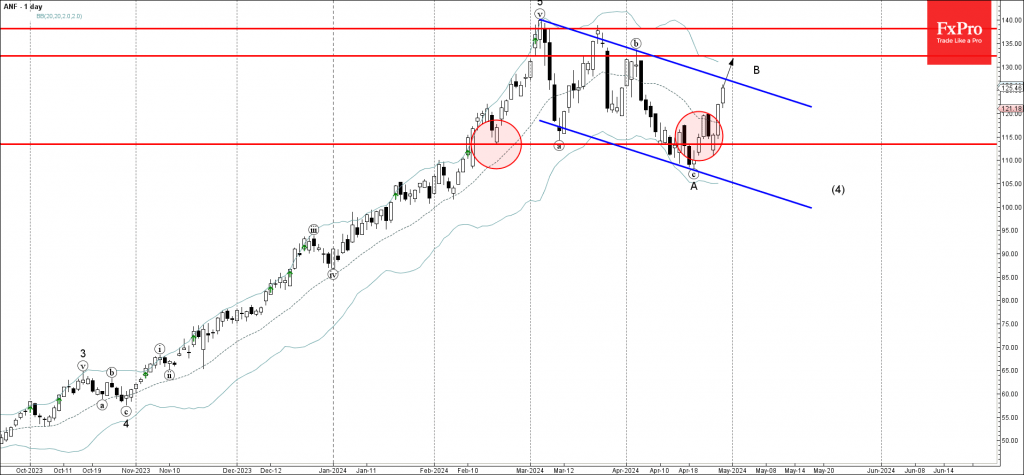
  • ANF reversed from key support level 113.40
  • Likely to rise to resistance level 132.31

ANF rising inside the minor correction B, which started earlier from the key support level 113.40, which has been reversing the pair from the middle of February.

The price is currently approaching the resistance trendline of the daily down channel from March – which should be broken for the price to rise further.

Given the strong multi-month uptrend, ANF air can be expected rise further to the next resistance level 132.31 (top of wave (b) from the start of April).

The FxPro Tech Analysis Team

The FxPro technical experts prepare a daily analysis of the most active currency pairs (majors, crosses, exotics) and commodities. Selected instruments are reviewed on daily trends (D1, H4), using the active Elliott Wave setups, Japanese candlesticks, indicators, and support/resistance levels.

Share
Published by
The FxPro Tech Analysis Team
Tags: ANF

Recent Posts

Pro News Flash: Gold Bulls Take Control

🥇 Gold is regaining momentum as investors lean into geopolitics, a softer US dollar and…

6 hours ago

The dollar is forced to retreat

• The reduction in geopolitical risks in Venezuela has weakened the greenback. •  Precious metal investors…

9 hours ago

Nikkei 225 Wave Analysis – 5 January 2026

Nikkei 225: ⬆️ Buy - Nikkei 225 broke resistance level 51160.00 - Likely to rise…

24 hours ago

Gold Wave Analysis – 5 January 2026

Gold: ⬆️ Buy - Gold reversed from support zone - Likely to rise to resistance…

24 hours ago

Ethereum Wave Analysis – 5 January 2026

Ethereum: ⬆️ Buy - Ethereum broke round resistance level 3000.00 - Likely to rise to…

1 day ago

Platinum Wave Analysis – 5 January 2026

Platinum: ⬆️ Buy - Platinum reversed from support zone - Likely to rise to resistance…

1 day ago

This website uses cookies