Categories: Technical analysis

American express Wave Analysis 23 February, 2021

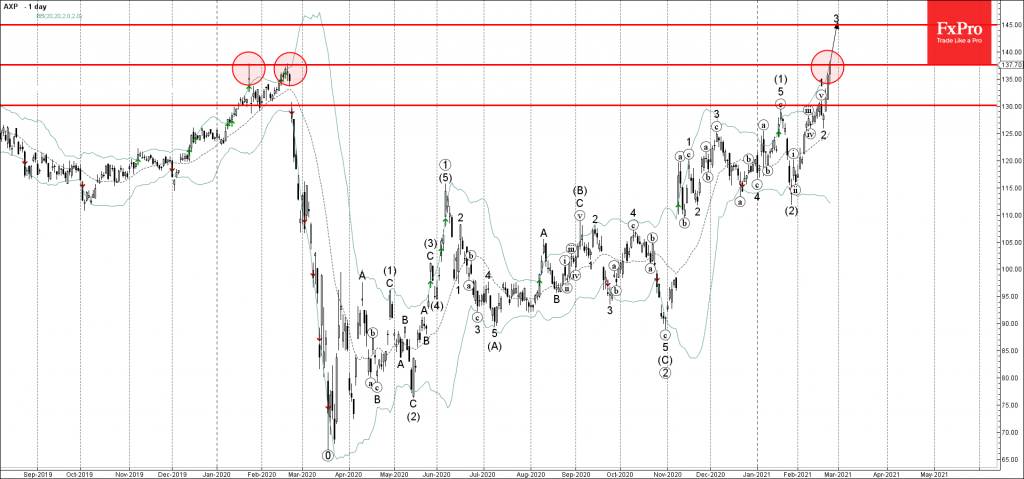
• American approached long-term resistance level 137.60

• Likely to reach resistance 145.00

American express recently approached the key long-term resistance level 137.60 (which reversed the price in January and in February of 2020 –as can be seen below).

The resistance zone near the resistance level 137.60 is strengthened by the upper daily Bollinger Band.

If American express closes today above the resistance level 137.60 – the price can then rise to the next resistance level 145.00.

The FxPro Tech Analysis Team

The FxPro technical experts prepare a daily analysis of the most active currency pairs (majors, crosses, exotics) and commodities. Selected instruments are reviewed on daily trends (D1, H4), using the active Elliott Wave setups, Japanese candlesticks, indicators, and support/resistance levels.

Share
Published by
The FxPro Tech Analysis Team
Tags: AXP

Recent Posts

JPMorgan Chase Wave Analysis – 18 December 2025

JPMorgan Chase: ⬇️ Sell - JPMorgan Chase reversed from resistance area - Likely to fall…

7 hours ago

EURUSD Wave Analysis – 18 December 2025

EURUSD: ⬇️ Sell - EURUSD reversed from resistance area - Likely to fall to support level…

7 hours ago

AUDJPY Wave Analysis – 18 December 2025

AUDJPY: ⬆️ Buy - AUDJPY reversed from support area - Likely to rise to resistance…

8 hours ago

Palladium Wave Analysis – 18 December 2025

Palladium: ⬆️ Buy - Palladium broke multi-month resistance level 1600.00 - Likely to rise to resistance…

8 hours ago

GBPUSD. Current situation #tradelikeapro #trading #tradingstrategy #tradingshorts #gbpusd #gbp

Today is Thursday, the 18th of December, and we'll be talking about the British pound…

13 hours ago

Bitcoin is holding, while Solana is on the edge

Bitcoin remains stable near $87K, outperforming altcoins, while Solana faces key support at $120. Institutional…

15 hours ago

This website uses cookies