Categories: Technical analysis

Amazon Wave Analysis 3 August 2023

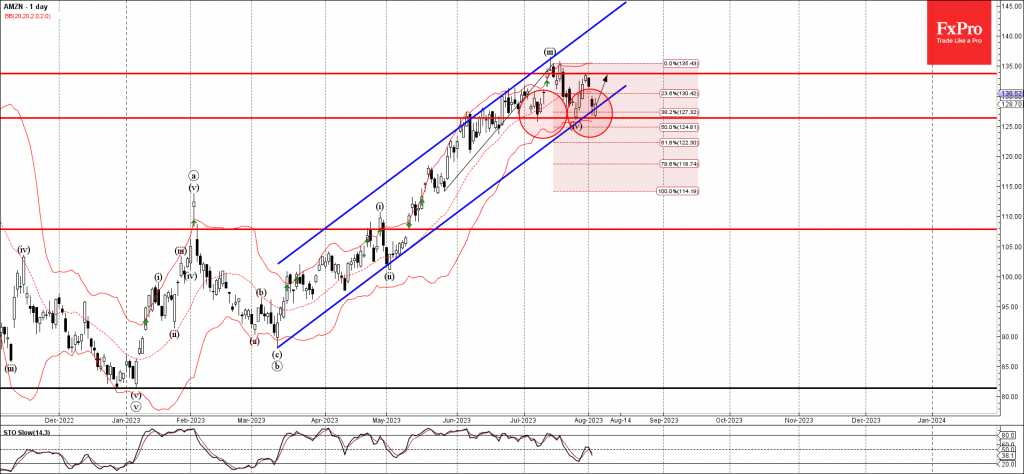
– Amazon reversed from support level 126.40

– Likely to rise to resistance at 133.75

Amazon recently reversed up from the key, multi-month support level 126.40, former resistance from June, which has been reversing the price from the start of June.

The support level 126.40 was strengthened by the intersecting lower daily Bollinger Band, support trendline of the daily up channel from March and the 38.2% Fibonacci correction of the upward impulse from May.

Given the clear daily uptrend, Amazon can be expected to rise further toward the next resistance at 133.75.

The FxPro Tech Analysis Team

The FxPro technical experts prepare a daily analysis of the most active currency pairs (majors, crosses, exotics) and commodities. Selected instruments are reviewed on daily trends (D1, H4), using the active Elliott Wave setups, Japanese candlesticks, indicators, and support/resistance levels.

Share
Published by
The FxPro Tech Analysis Team
Tags: amazon

Recent Posts

Crude Oil counteracts

Middle East tensions and Venezuelan supply shifts drive Brent crude volatility, with geopolitical risks and…

2 hours ago

Crypto market grows with risk appetite in stocks

Crypto market edges up as risk appetite returns; Bitcoin and Ethereum recover, despite investor caution…

3 hours ago

The yen returned to the Takaichi trade

The dollar resumed its growth after the lawsuit against the Fed chairman. Rumours of early…

4 hours ago

Nat Gas Current situation #tradelikeapro #trading #natgas #tradingstrategy #tradingshorts

Today is Tuesday, the 13th of January, and we will talk about the natural gas…

5 hours ago

Bitcoin Cash Wave Analysis – 12 January 2026

Bitcoin Cash: ⬇️ Sell - Bitcoin Cash reversed from resistance area - Likely to fall…

15 hours ago

EURJPY Wave Analysis – 12 January 2026

EURJPY: ⬆️ Buy - EURJPY reversed from support area - Likely to rise to resistance…

15 hours ago

This website uses cookies