Categories: Technical analysis

Amazon Wave Analysis – 20 October 2025

Amazon: ⬆️ Buy

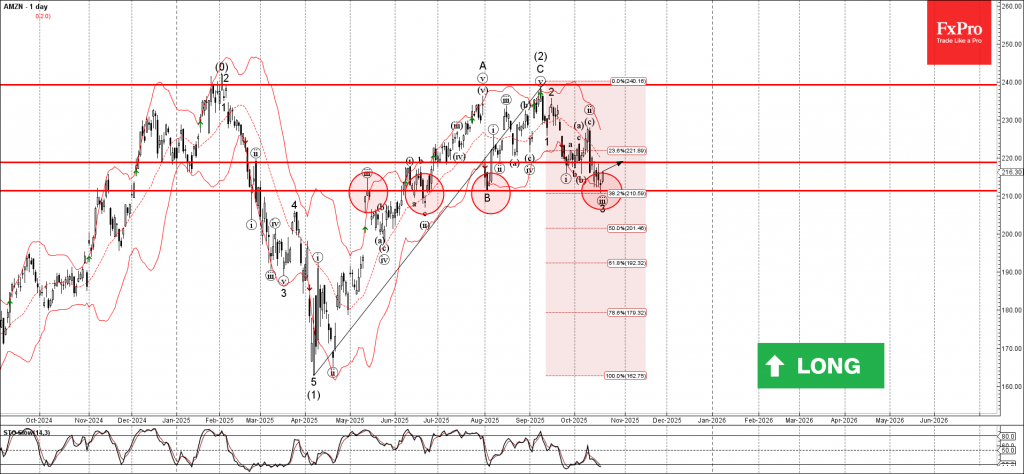
– Amazon reversed from support level 210.00

– Likely to rise to resistance level 220.00

Amazon recently reversed from the support area between the key support level 210.00 (which has been reversing the price from June), lower daily Bollinger Band and the 38.2% Fibonacci correction of the upward impulse from April

The upward reversal from this support zone created the daily Japanese candlesticks reversal pattern Hammer.

Given the strength of the support level 210.00 and the oversold daily Stochastic, Amazon can be expected to rise to the next resistance level 220.00 (former strong support from September).

The FxPro Tech Analysis Team

The FxPro technical experts prepare a daily analysis of the most active currency pairs (majors, crosses, exotics) and commodities. Selected instruments are reviewed on daily trends (D1, H4), using the active Elliott Wave setups, Japanese candlesticks, indicators, and support/resistance levels.

Share
Published by
The FxPro Tech Analysis Team
Tags: amazon

Recent Posts

Pro News Flash: Gold Bulls Take Control

🥇 Gold is regaining momentum as investors lean into geopolitics, a softer US dollar and…

3 hours ago

The dollar is forced to retreat

• The reduction in geopolitical risks in Venezuela has weakened the greenback. •  Precious metal investors…

7 hours ago

Nikkei 225 Wave Analysis – 5 January 2026

Nikkei 225: ⬆️ Buy - Nikkei 225 broke resistance level 51160.00 - Likely to rise…

21 hours ago

Gold Wave Analysis – 5 January 2026

Gold: ⬆️ Buy - Gold reversed from support zone - Likely to rise to resistance…

21 hours ago

Ethereum Wave Analysis – 5 January 2026

Ethereum: ⬆️ Buy - Ethereum broke round resistance level 3000.00 - Likely to rise to…

21 hours ago

Platinum Wave Analysis – 5 January 2026

Platinum: ⬆️ Buy - Platinum reversed from support zone - Likely to rise to resistance…

21 hours ago

This website uses cookies