Categories: Technical analysis

Amazon Wave Analysis – 17 February 2023

 • Amazon reversed from resistance level 100.00

• Likely to fall to support level 91.50

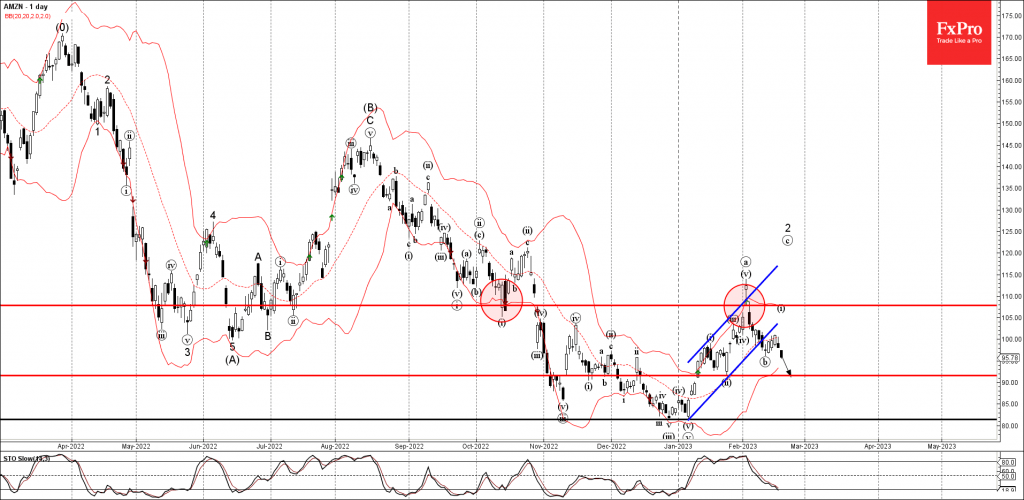
Amazon recently reversed down from the round resistance level 100.00, intersecting with the former support trendline of the daily up channel from the start of January (acting as resistance after it was broken).

The downward reversal from the resistance level 100.00 is aligned with the clear multi-month downtrend that can be seen on the daily Amazon charts.

Amazon can be expected to fall further toward the next support level 91.50 (which stopped wave (ii) from the middle of January).

The FxPro Tech Analysis Team

The FxPro technical experts prepare a daily analysis of the most active currency pairs (majors, crosses, exotics) and commodities. Selected instruments are reviewed on daily trends (D1, H4), using the active Elliott Wave setups, Japanese candlesticks, indicators, and support/resistance levels.

Share
Published by
The FxPro Tech Analysis Team
Tags: amazon

Recent Posts

Bitcoin can’t accelerate but won’t give up trying 

Market picture  The crypto market capitalisation fell by 1.7% in 24 hours to $2.29 trillion,…

58 mins ago

USDJPY Wave Analysis 6 May 2024

- USDJPY reversed from support zone - Likely to rise to resistance level 155.65 USDJPY…

16 hours ago

Gold Wave Analysis 6 May 2024

- Gold reversed from support zone - Likely to rise to resistance level 2400.00 Gold…

16 hours ago

Oil Bounces Locally, Global Support 5% below Spot Price

The number of operating oil rigs in the US fell by 7 to 499. This…

20 hours ago

Crypto Market Tries to Break Local Downtrend

Market picture  Crypto market capitalisation has been up 2% over the past seven days and…

1 day ago

Adobe Wave Analysis 3 May 2024

- Adobe reversed from support zone - Likely to rise to resistance level 500.00 Adobe…

4 days ago

This website uses cookies