Categories: Technical analysis

Amazon Wave Analysis 11 September 2024

– Amazon broke resistance area

– Likely to rise to resistance level 190.00

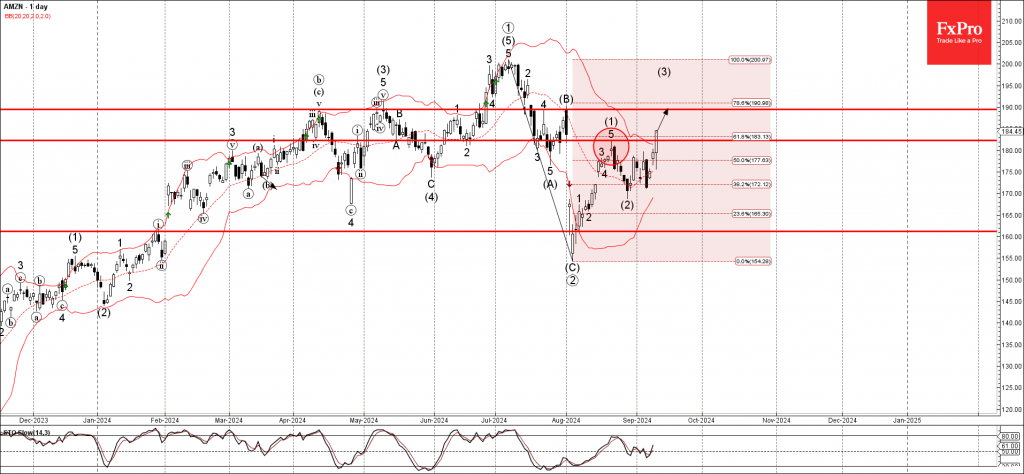
Amazon recently broke the resistance area located between the resistance level 182.30 (top of wave (1) from the middle of August) and the 61.8% Fibonacci correction of the downward impulse from July.

The breakout of this resistance area accelerated the active medium-term impulse wave (3).

Given the clear daily uptrend, Amazon can be expected to rise further to the next resistance level 190.00 (which stopped waves 4 and (B) at the end of July).

The FxPro Tech Analysis Team

The FxPro technical experts prepare a daily analysis of the most active currency pairs (majors, crosses, exotics) and commodities. Selected instruments are reviewed on daily trends (D1, H4), using the active Elliott Wave setups, Japanese candlesticks, indicators, and support/resistance levels.

Share
Published by
The FxPro Tech Analysis Team
Tags: amazon

Recent Posts

The Fed’s big rate and projections cut

The Fed cut the rate by 50 bps, This change was not fully factored into…

4 hours ago

Crypto market climbs out of the pit

The crypto market as a whole and Bitcoin hit three-week highs, but are still in…

11 hours ago

AUDCAD Wave Analysis 18 September 2024

- AUDCAD broke pivotal resistance level 0.9170 - Likely to rise to resistance level 0.9260…

24 hours ago

WTI Wave Analysis 18 September 2024

- WTI reversed from round resistance level 70.00 - Likely to fall to support level…

24 hours ago

Strong data didn’t derail markets from expectations of a 50bp Fed cut

US retail sales rose 0.1% m/m in August, better than forecast, but sales growth in…

1 day ago

The crypto market gets a boost from stocks

Market Picture The crypto market has gained 2.1% in the last 24 hours to reach…

1 day ago

This website uses cookies