Categories: Technical analysis

Alibaba Wave Analysis – 6 July, 2020

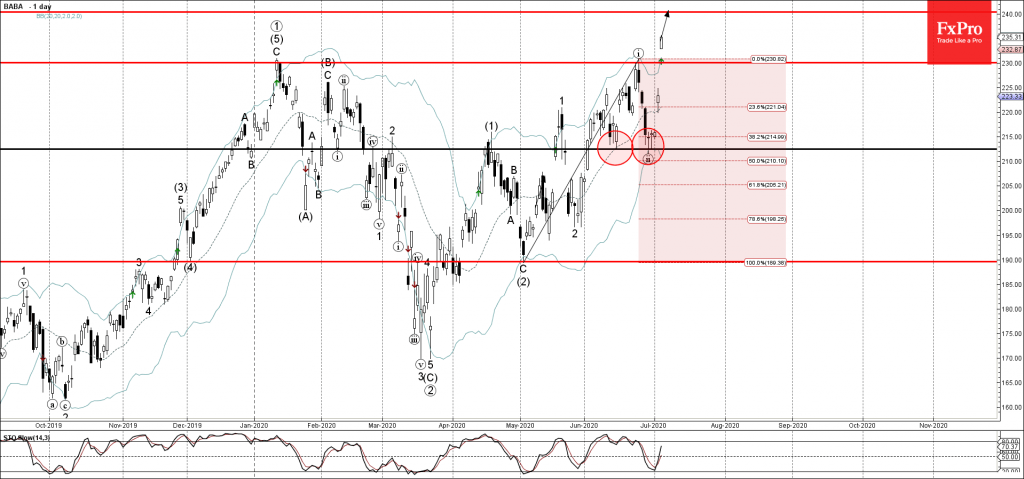
• Alibaba broke key resistance level 230.00

• Likely to rise to 240.00

Alibaba recently broke with the sharp upward gap above the key resistance level 230.00 (former multi-month high from January and June).

The breakout of the resistance level 230.00 should accelerate the active different-length impulse waves (iii), 3 and (3). Alibaba is likely to rise further toward the next resistance level 240.00. Strong support now stands at the price level 230.00.

The FxPro Tech Analysis Team

The FxPro technical experts prepare a daily analysis of the most active currency pairs (majors, crosses, exotics) and commodities. Selected instruments are reviewed on daily trends (D1, H4), using the active Elliott Wave setups, Japanese candlesticks, indicators, and support/resistance levels.

Share
Published by
The FxPro Tech Analysis Team
Tags: BABA

Recent Posts

AUDJPY Wave Analysis – 5 December 2025

AUDJPY: ⬆️ Buy - AUDJPY broke long-term resistance level 102.30 - Likely to rise to…

17 hours ago

Aptos Wave Analysis – 5 December 2025

Aptos: ⬇️ Sell - Aptos testing major support at 1.688 - Likely to fall to…

17 hours ago

Pro News Weekly: Market Shake-Up, Dollar Drops, Gold Surges, Bitcoin Wobbles!

Welcome to Pro News Flash! 💵 The U.S. dollar slips 🏆 Major stock indices struggle…

24 hours ago

Solana Wave Analysis – 5 December 2025

Solana: ⬇️ Sell - Solana reversed from resistance zone - Likely to fall to support…

1 day ago

EURAUD Wave Analysis – 5 December 2025

EURAUD : ⬇️ Sell - EURAUD broke the support level 1.7600 - Likely to fall…

1 day ago

Forex has set its priorities

In 2026, experts favour the yen, see modest euro growth, and expect pressure on the…

1 day ago

This website uses cookies