Categories: Technical analysis

Alibaba Wave Analysis – 29 November, 2019

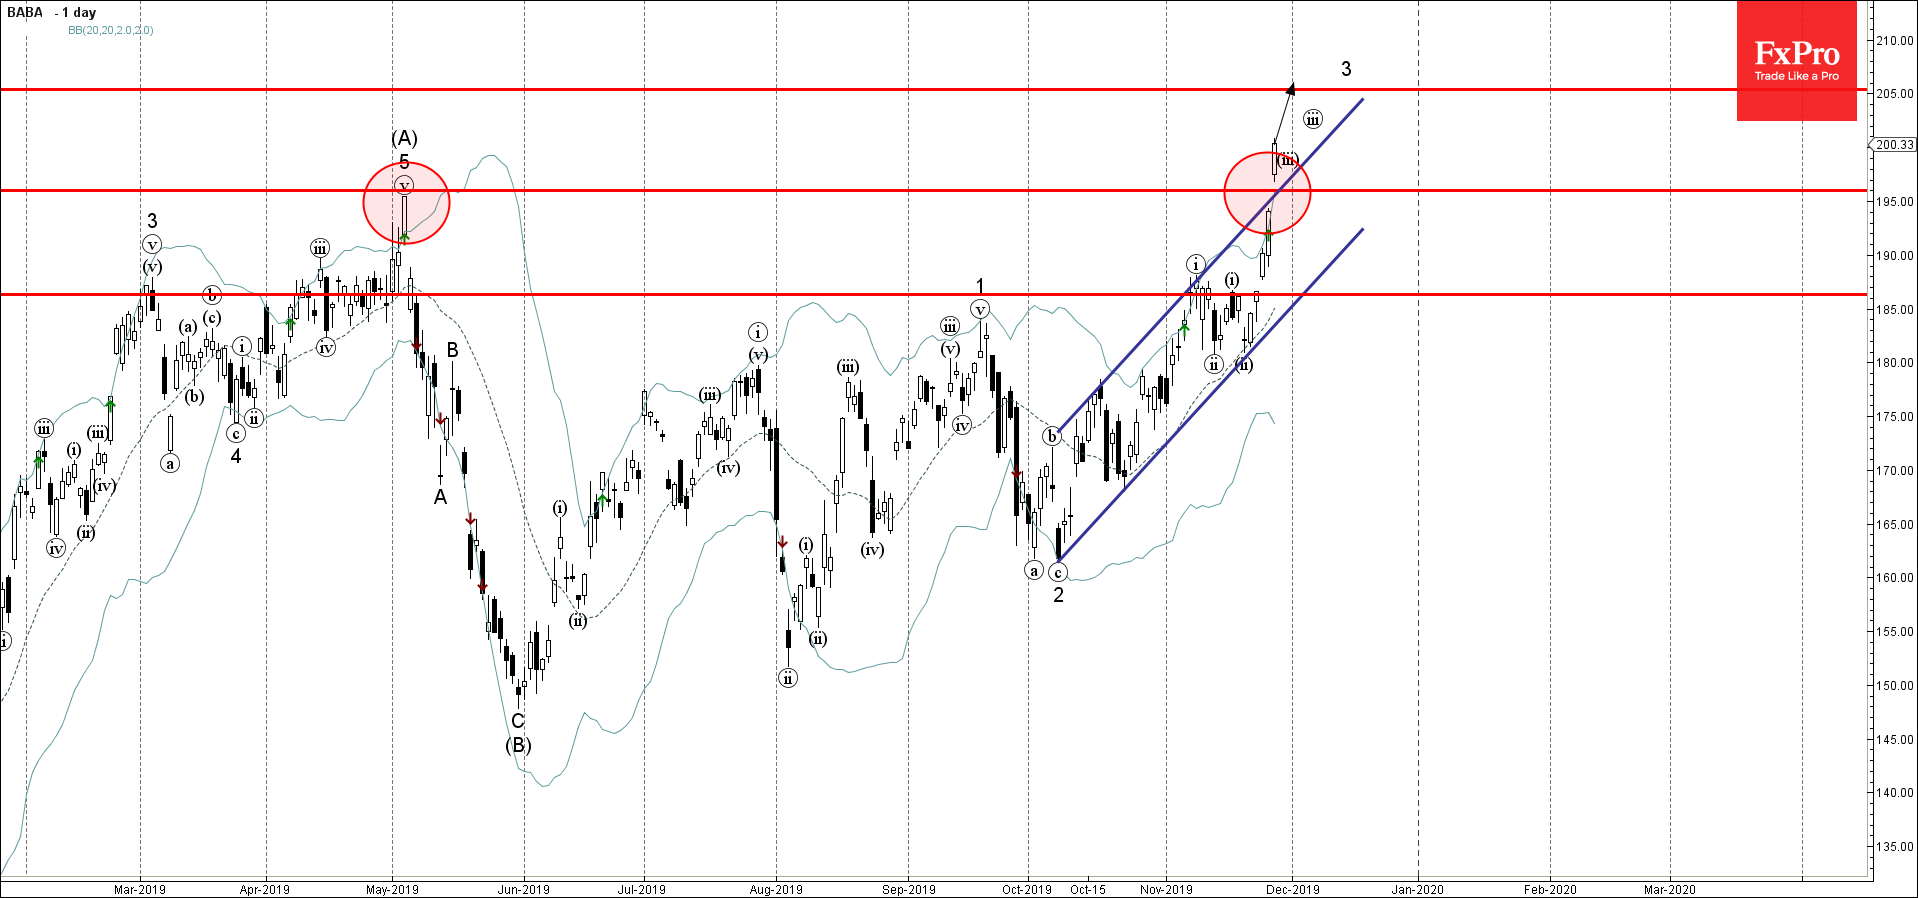
  • Alibaba broke strong resistance level 195.95
  • Likely to rise to 205.00

Alibaba recently broke the resistance trendline of the daily up channel from the start of October – intersecting with the powerful resistance level 195.95 (multi-month high from May).

The breakout of this up channel accelerated the active medium-term impulse wave 3 of the upward impulse sequence (C) from May.

Alibaba is expected to rise further toward the next resistance level 205.00 (forecast price for the completion of the active impulse wave 3).

The FxPro Tech Analysis Team

The FxPro technical experts prepare a daily analysis of the most active currency pairs (majors, crosses, exotics) and commodities. Selected instruments are reviewed on daily trends (D1, H4), using the active Elliott Wave setups, Japanese candlesticks, indicators, and support/resistance levels.

Share
Published by
The FxPro Tech Analysis Team
Tags: BABA

Recent Posts

Solana Wave Analysis – 5 December 2025

Solana: ⬇️ Sell - Solana reversed from resistance zone - Likely to fall to support…

48 minutes ago

EURAUD Wave Analysis – 5 December 2025

EURAUD : ⬇️ Sell - EURAUD broke the support level 1.7600 - Likely to fall…

48 minutes ago

Forex has set its priorities

In 2026, experts favour the yen, see modest euro growth, and expect pressure on the…

5 hours ago

Bear market rebound in crypto is likely to continue

Crypto rebounds continue; Bitcoin faces resistance, with a mixed market outlook ahead, as regulatory changes…

6 hours ago

Coca-Cola Wave Analysis – 4 December 2025

Coca-Cola: ⬇️ Sell - Coca-Cola reversed from long-term resistance level 73.25 - Likely to fall to…

19 hours ago

DraftKings Wave Analysis – 4 December 2025

DraftKings: ⬆️ Buy - DraftKings reversed from support zone - Likely to rise to resistance level…

19 hours ago

This website uses cookies